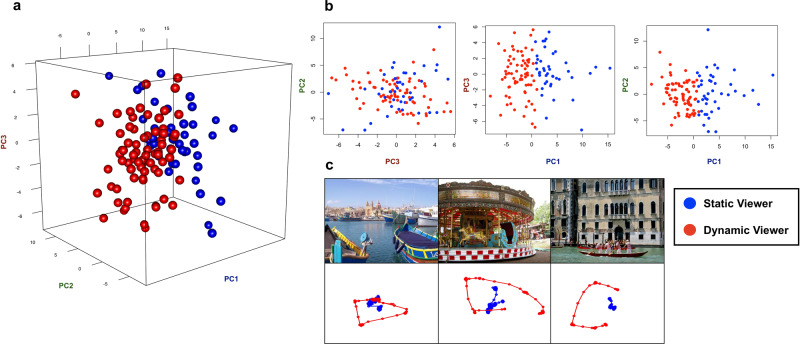
Fig. 3. Relation between clusters and principal components.
a Clusters’ projection in the three-dimensional space defined by the first three principal components. b Two-dimensional relation between PC scores. The values of PC1 are those best describing the two clusters; c Examples of Static and Dynamic eye-movements pattern (each dot represents gaze position sampled at a timepoint). Static viewers are represented in blue and Dynamic viewers in red.

