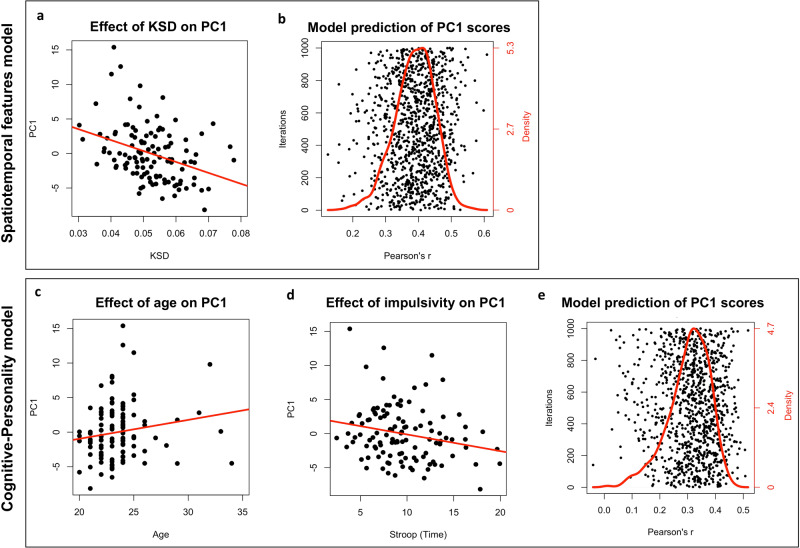
Fig. 6. Significant results of regression models and prediction performance.
a Significant relation between KSD and PC1 scores in the best visual exploration model (i.e., Spatiotemporal features model); b Pearson’s correlation values between actual and model-predicted PC1 scores obtained over 1,000 iterations of split-half validation procedure. At each iteration the sample (n = 114) was randomly split into two halves, one was used as training set to fit the regression model and the other one (i.e., test set) was used to assess the model prediction of PC1 scores for unseen data. The red line indicates the frequency distribution of the correlation values in the scatter plot. The peak of the red line indicates the mean r value = 0.42. Significant effects of Age (c) and Stroop test (d) on PC1 scores in the Cognitive-Personality model; e Pearson’s correlation values between actual and model-predicted PC1 scores as described before (see b). The peak of the red line indicates the mean r value = 0.32.

