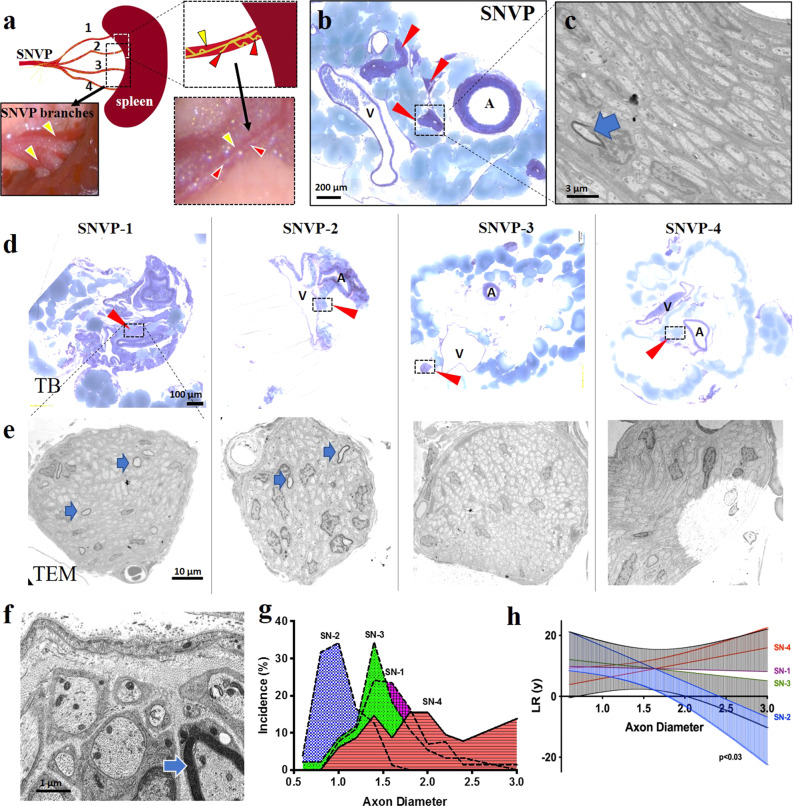
Fig. 3. Splenic neurovascular plexus asymmetric branching.
a Schematic of the rat SNVP splitting into four-terminal branches prior to entering into the spleen. Inserts: Splenic vasculature (yellow arrowheads) and the SN (red arrowheads). b Toluidine blue (TB) staining, red arrows point to the location of the SN fascicles between the artery (A) and vein (V). c unmyelinated SN axons by TEM with a single myelinated axon (blue arrow). d Representative images of TB staining of the four-terminal SN branches, with nerve fascicles in inserts (red arrowheads). e TEM micrographs of axonal composition in each terminal branch. Myelinated axons (blue arrows) were observed in SN1–2, but not in SN 3–4. f High TEM magnification of SN-2 axons. g Axon diameter distribution in the SN branches. h Linear regression analysis of axon diameter distribution. Kolmogorov–Smirnov normality test was used to determine the difference in axon diameter population in different groups (n = 4 animals). Data are shown as mean (solid lines) and error (95 confidence interval; top for SN1 and SN4, and bottom for SN3 and SN2). SN1–4 are shown by different colors. SN splenic nerve, SNVP splenic neurovascular plexus, TEM transmission electron microscopy. The slope between SN-1 and SN-4 is significantly different (p < 0.03).

