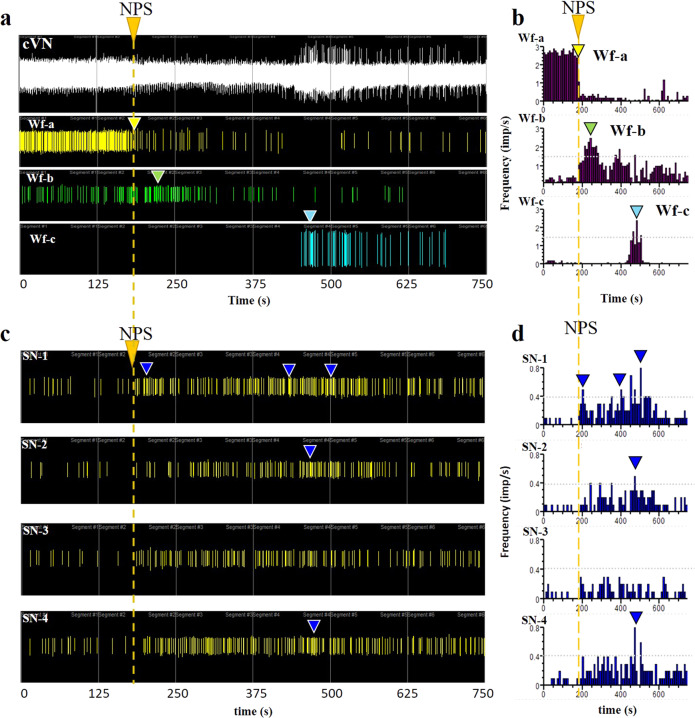
Fig. 5. Hypotension inhibits cVN activity, followed by differential splenic branch activity.
a NPS administration (orange arrow and dashed line) causes a reduction in cVN activity (Wf-a, yellow arrow), and activation of two separate Wf (Wf-a and b, green and blue arrows, respectively), as demonstrated by the frequency histograms (b), changes in amplitude of the signal at 200 s compared to baseline was 1.6 ± 1.02 µV (Supplementary Fig. 4). c Simultaneous recording of neural activity in the four splenic branches showed a differential temporal response in frequency firing, with SN-1 following the loss of cVN Wfa, and SN-2 and SN-4 activated simultaneously with VN Wf-c. Delta in amplitude in response to the drop in mean arterial pressure (baseline vs. 200 s after NPS administration) where 4.6 ± 1.3, 3.4 ± 1.9, 0.9 ± 0.8, 2.8 ± 1.2, for SN-1–4, respectively. Tukey’s multiple comparisons tests showed SN-1 vs. SN-3 **P = 0.006, alpha = 0.05, n = 5 (Supplementary Fig. 4). d Frequency histograms show specific time of increased activity over a 40% threshold (blue arrowheads in c and d). Representative waveforms were observed from n = 6 animals. NPS nitroprusside, cVN cervical vagus nerve, Wf waveform, SN splenic nerve.

