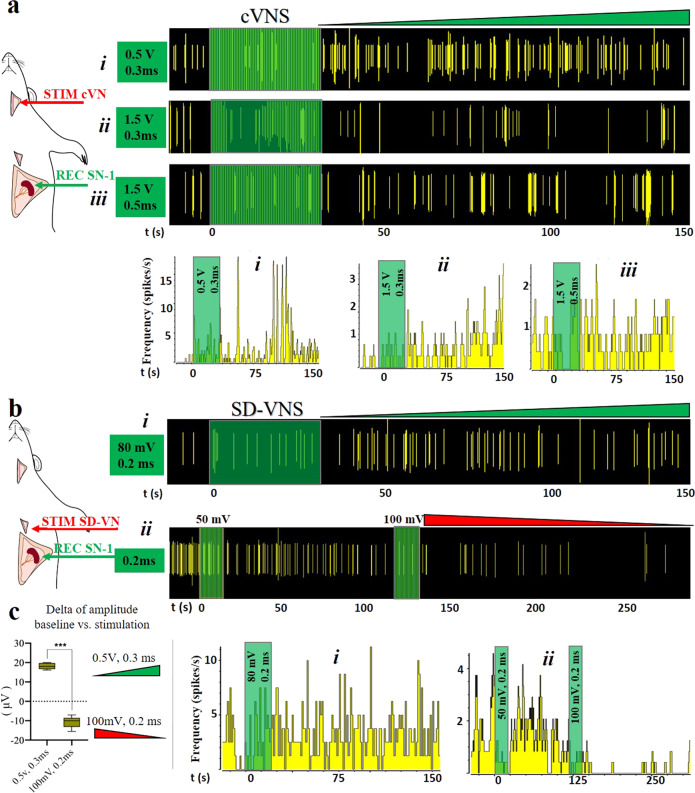
Fig. 7. Inhibition of apical branch activity by cVNS.
a The activity in SN-1 after cVNS increased at (i) 0.5 V. (ii) At 1.5 V cVNS caused the opposite effect. (iii) Increasing the pulse to 0.5 ms, at 1.5 V had an intermediate effect. b SD-VNS with: (i) 0.2 ms stimulation at 80 mV caused an increase in activity, whereas stimulation of 50 and 100 mV (ii), inhibited SN-1 spontaneous activity. Green and red triangles indicate an increase and decrease in activity, respectively. Rate histograms are presented for each raster plot, representative waveforms are plotted, bin = 1 s. c Delta of changes on the amplitude of the signal (baseline vs. stimulation at 200 s) means ± standard deviation are: increase on 18.16 ± 1.6 and decrease on −10.68 ± 3.07 μV for 0.5 V, 0.3 ms and 100 mV, 0.2 ms, respectively. T test análisis, p < 0.0001 (n = 3 rats, 3–5 repetitions each). cVNS cervical vagus nerve stimulation, SD-VNS subdiaphragmatic vagus nerve stimulation, SN splenic nerve.

