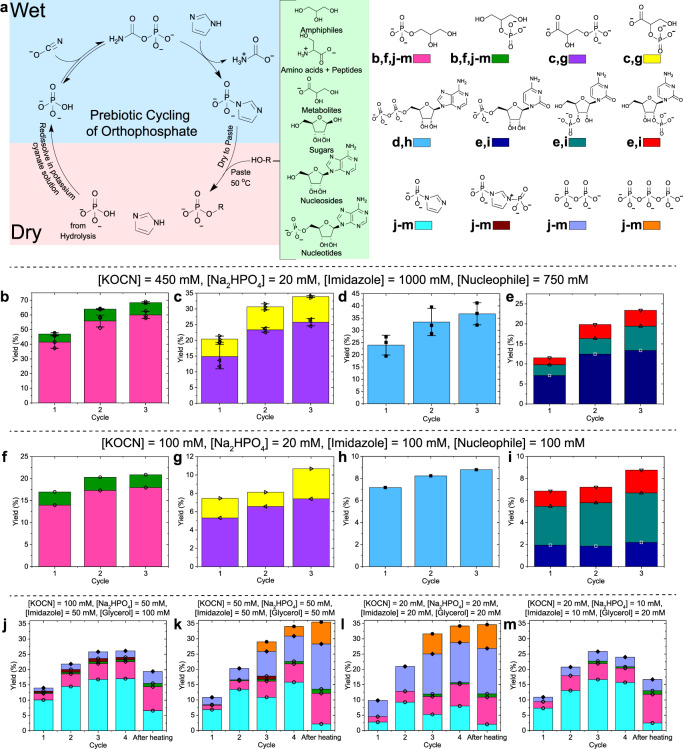
Fig. 3. The physicochemical orthophosphate cycle, which upon repeated cycling enables a stepwise increase in the incorporation of orthophosphate into prebiotically important organic compounds.
a Overview of the orthophosphate cycling experiment. The second and third cycles were performed by redissolving the paste in a solution with the respective potassium cyanate concentration for each set of experiments. The plots b–m show the yield of incorporation of orthophosphate into phosphorylated products over the course of three cycles and this is referred to as ‘Yield’ on the y-axis. b–e Experiments initiated from a solution of 450 mM potassium cyanate, 1.0 M imidazole and 20 mM sodium phosphate with 750 mM of the nucleophile (glycerol, glycerate, AMP and the nucleoside cytidine). Error bars are based on the SD determined from three repeats. f–i Experiments initiated from a solution of 100 mM potassium cyanate, 100 M imidazole and 20 mM sodium phosphate with 100 mM of the nucleophile (glycerol, glycerate, AMP and the nucleoside cytidine). j–m Wet/dry cycling experiments performed at lower initial concentrations in the presence of glycerol, which demonstrate the formation of imidazole phosphate as the solution concentrates while drying and the transfer of phosphate to the nucleophile in the paste. To emphasize the process of a solution concentrating as it dries, the yield of imidazole phosphate and all products that it forms are shown.

