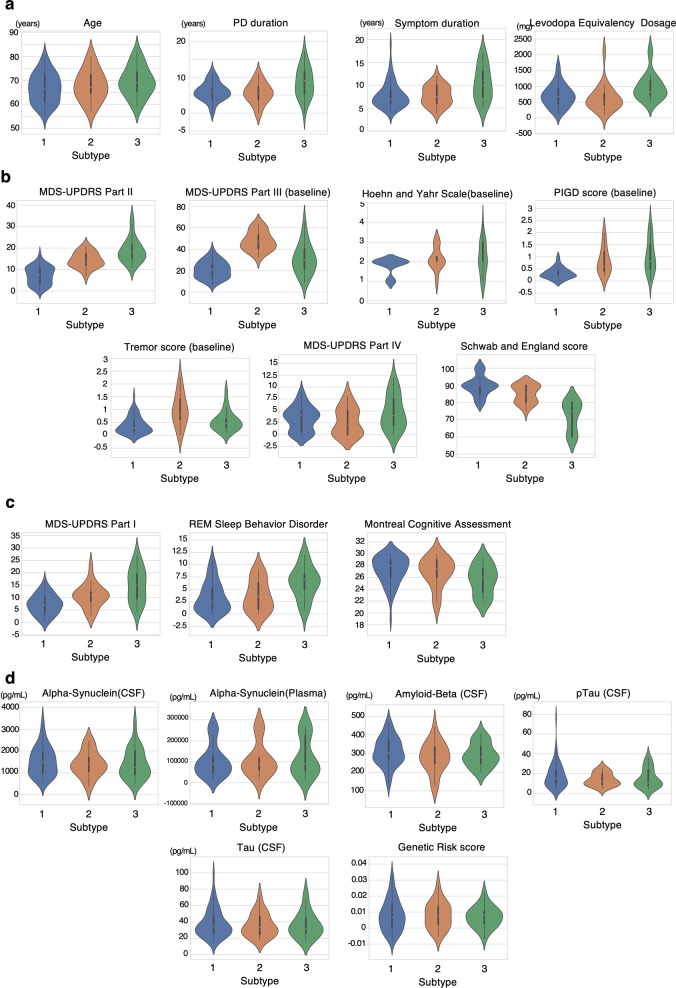
Fig. 1. Violin plots showing characteristics of the identified subtypes.
Feature distributions of (a) demographics, (b) motor clinical assessments, (c) non-motor clinical assessments, and (d) biospecimen measurements/genetic risk score. The violin plots show a kernel density estimate of the feature distribution. The white dot within each plot represents the median, the edges of the box represent the interquartile and the line represents 1.5 times the interquartile range.

