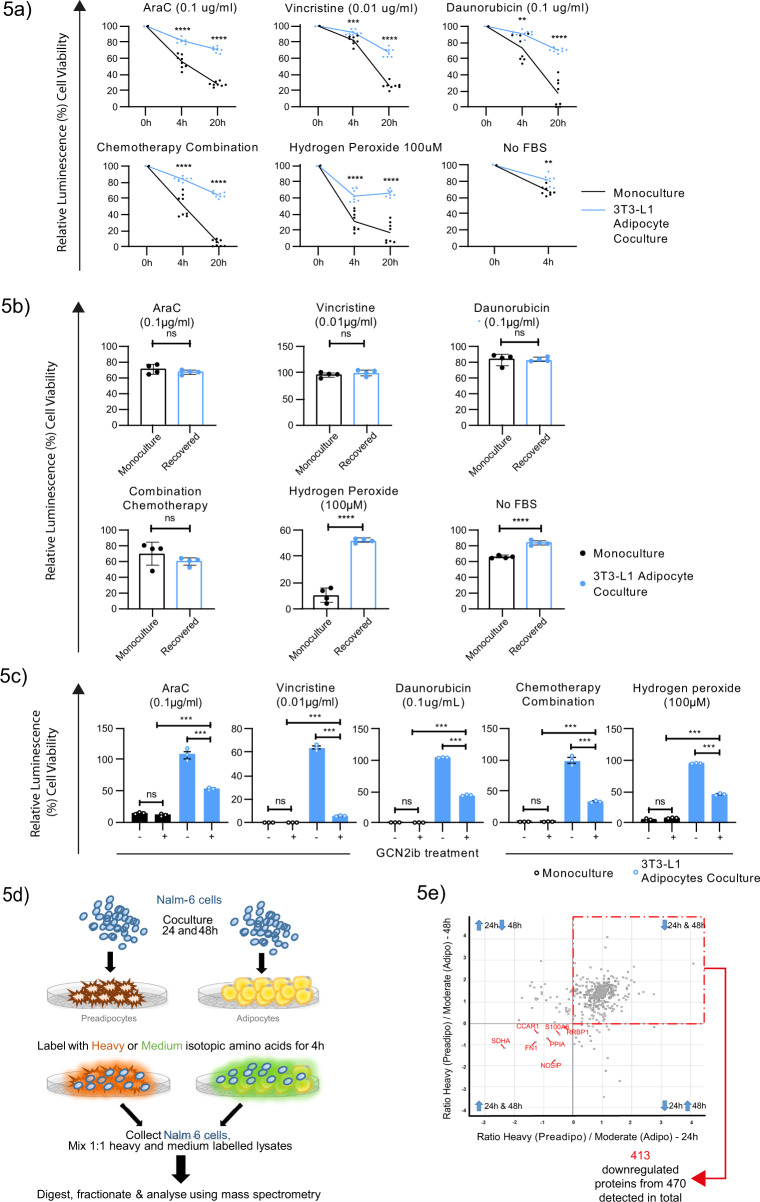
Fig. 5. Adipocyte-adapted ALL proteomes increase global stress resistance.
a Cell viability of Nalm-6 cells from monoculture (black, n = 8) vs 3T3-L1 adipocyte coculture (blue, n = 8) in the presence of the indicated chemotherapeutic agents or mitosis-independent stressors (no FBS and hydrogen peroxide). Data are presented relative to vehicle controls. b Cell viability of Nalm-6 cells after +48 h recovery from 3T3-L1 adipocyte coculture (blue, n = 4) or from monoculture (black, n = 4) after exposure to mitosis-dependant chemotherapy or mitosis-independent stressors (no FBS and hydrogen peroxide). Data are presented relative to vehicle controls. c Cell viability of Nalm-6 monocultured (black, n = 3) or 3T3-L1 adipocyte-cocultured Nalm-6 cells (blue, n = 3) in the presence of GCN2ib treatment (5 µg/mL) and the indicated cellular stressors. d Schematic for pulsed SILAC-based proteomic analysis. Nalm-6 cells cocultured with either 3T3-L1 adipocytes or preadipocytes were pulsed at +24 h and at 48 h with either ‘heavy’ or ‘medium’ isotope-labelled amino acids. Following a 4 h incubation, Nalm-6 cells were separated from their microenvironment for protein extraction. Lysates were mixed in equal amounts (between heavily and medium labelled samples at each time point), digested, fractionated and analysed using mass spectrometry.e Scatter plot showing the normalized log2 ratio of proteins detected following pulsed SILAC-based proteomic analysis in Nalm-6 cells cocultured with 3T3-L1 adipocytes (Adipo) relative to preadipocytes (preadipo) at +24 h vs 48 h from one experiment. Blue Arrows describe the direction of change in adipocyte-specific coculture. Data are presented as mean values ± SEM values of independent experiments (n = 2 in (a) with four replicates, n = 1 with four replicates in (b, c). Statistical significance was assessed using 2-sided unpaired t tests (a, b for the single-agent treatments), Mann–Whitney U test for combination chemotherapy treatment (b) One-way ANOVA followed by Tukey’s test for multiple comparisons c. **p < 0.01, ***p < 0.001, ****p < 0.0001.

