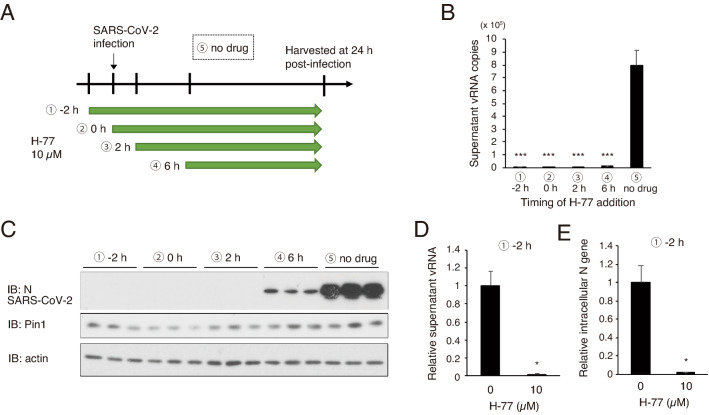
Figure 3.
Effect of H-77 treatment timing on growth inhibition of SARS-CoV-2. VeroE6/TMPRSS2 cells were infected with SARS-CoV-2 (MOI of 0.01), and H-77 (final concentration 10 µM) was added at different times as indicated. Cells and supernatants were harvested 24 h after infection. (A) Schematic diagram showing the timing of drug addition and experimental conditions. ① 2 h before viral infection, ② simultaneously with a viral infection, ③ 2 h after infection, ④ 6 h after infection, and ⑤ without drug addition. (B) Copy number per PCR reaction (8 µl) of vRNA in the culture supernatant 24 h after infection (n = 3). Error bars indicate standard deviation. ***P < 0.001, Mann–Whitney U test, compared with ⑤ no drug. (C) Western blotting of cell lysates with SARS-CoV-2 N, Pin1, and actin antibodies (Triplicate in the figure). Full-length blots are shown in Supplementary Fig. 4. (D, E) VeroE6/TMPRSS2 cells were pretreated with 10 µM H-77 under the condition described in ① (starting from 2 h before infection), and RNA was extracted from the cells 24 h after viral infection. RT-qPCR was used to measure vRNA in the supernatant collected at the same time (n = 3) (D) and intracellular N genes (mainly mRNA, adjusted for total RNA content) (n = 3) (E). Error bars represent standard deviation. *P < 0.05, Mann–Whitney U test.

