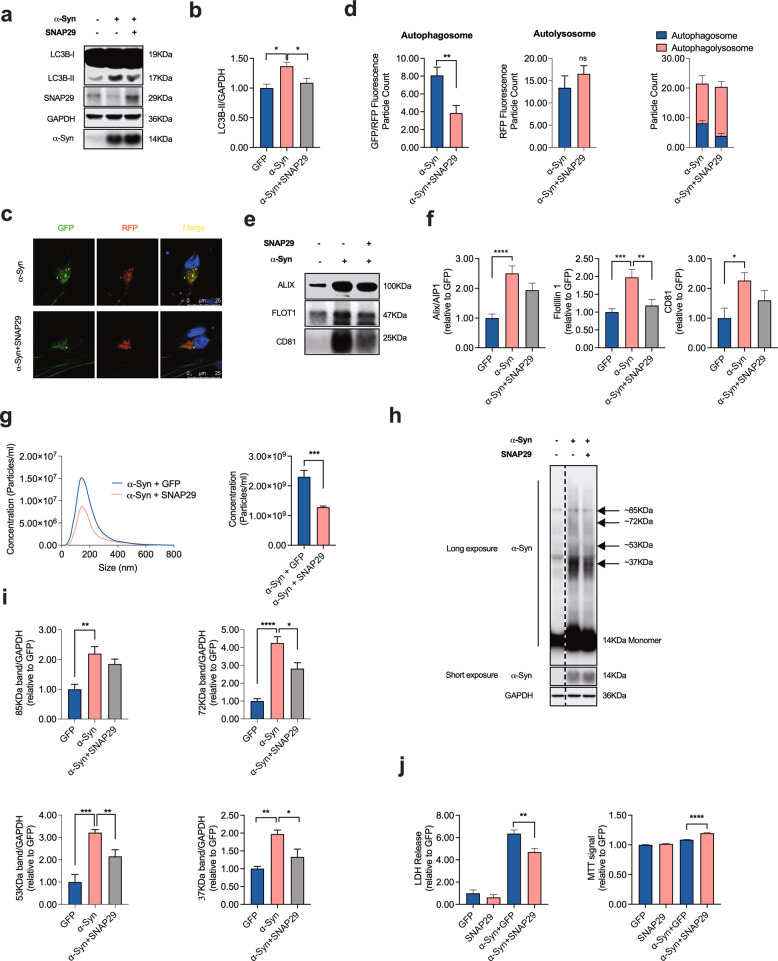
Fig. 5. SNAP29 co-expression rescues the α-Syn-induced impairment of autophagy turnover.
a, b Western blot and bar graph illustrating a decreased abundance of LC3B-II in α-Syn overexpressing cells in response to transfection with SNAP29 (n = 9/condition). c Photomicrographs from confocal microscopy of neurons transduced with GFP-RFP-LC3B, α-Syn and either with SNAP29 or vehicle (VEH). d Bar graphs illustrating the count of fluorescence positive particles. SNAP29 co-expression led to a significant decrease in GFP/RFP fluorescence positive particles (left graph), whereas RFP-fluorescence positive particles remained unchanged (middle graph). The ratio of GFP/RFP double-positive autophagosomes to RFP-positive autolysosomes is increased in response to SNAP29 transduction (for α-Syn n = 25 cells, for α-Syn + SNAP29 n = 28 cells). e, f Western blot and bar graphs illustrating the decreased abundance of the EV-associated proteins Alix/AIP1, Flotillin-1, and CD81 in EV-enriched medium pellets from cells in response to SNAP29 co-expression (n = 9/condition). g Results from NTA illustrating a decreased amount of EVs in response to co-transducing cells with SNAP29 (n = 9/condition). h, i Western blot and bar graphs illustrating the abundance of monomeric and oligomeric α-Syn in response to SNAP29 co-expression (n = 3/condition). j Bar graphs illustrating the quantification of LDH in the culture medium (left) and the MTT signal (right) in response to α-Syn and SNAP29 expression (n = 8/condition). For comparison of the means, a two-tailed unpaired t-test was used in panel d, g; a one-way ANOVA with Šidák’s test for multiple comparisons was used in panel b, f, i, j. ****P < 0.0001, ***P < 0.005, **P < 0.01, *P < 0.05. Data are shown as means ± SEM.

