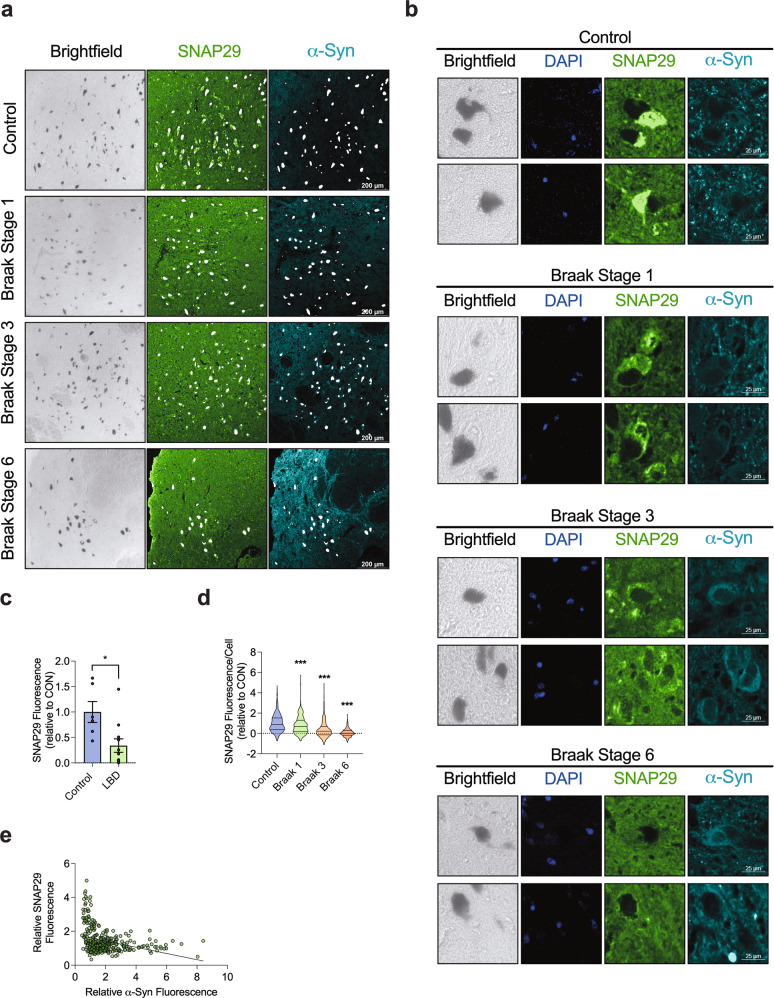
Fig. 7. The abundance of SNAP29 is stage-dependently decreased in neuromelanin-positive neurons from LBP cases.
a Representative photomicrograph from immunohistochemical staining of SNc post-mortem brain tissue at a low magnification (bar: 200 μm). Bright field images indicate neuromelanin pigment (black) in SNc DA neurons. Tissue sections were stained with an antibody against SNAP29 (green) and human α-Syn (blue), revealing a cytoplasmic staining pattern for SNAP29 in neuromelanin-positive neurons. 1st row: pictures from a control case, that had no LBP, 2nd to 4th row: pictures from cases that has LBP at different Braak stages. b Representative photomicrograph from immunohistochemical staining of SNc post-mortem brain tissue at a high magnification (bar: 25 μm) from healthy control cases (1st row) and from cases that has LBP at different Braak stages (2nd to 4th row). Tissue sections were stained with an antibody against SNAP29 (green), revealing a cytoplasmic staining pattern for SNAP29 in neuromelanin-positive neurons. Note a stage-dependent decrease of cytoplasmic SNAP29 fluorescence in LBP, whereas control neurons show a clear cytoplasmic SNAP29 fluorescence signal. c Bar graph illustrating the average abundance of SNAP29 in LBP cases including all Braak stages (1–6). The average fluorescence signal was analyzed per case (n of cases per condition; control: n = 6; Braak stage 1: n = 3; Braak stage 3: n = 2; and Braak stage 6 n = 6) d Bar graph illustrating a drop of SNAP29 in LBP cases. Different from c, the fluorescence signal was analyzed and computed in each neuromelanin-positive cell individually (n of cells per condition; control: n = 679; Braak stage 1: n = 440; Braak stage 3: n = 381; and Braak stage 6 n = 612), demonstrating a stage-dependent decline of SNAP29 fluorescence in SNc DA neurons of LBP cases. e Graph illustrating the correlation of the SNAP29 and α-Syn fluorescence signal in individual SNc neurons (n = 352 cells). For comparison of the means, a two-tailed unpaired t-test was used in panel c; a one-way ANOVA with Šidák’s test for multiple comparisons was used in panel d. A linear regression was calculated in panel e. ***P < 0.005, *P < 0.05. Data are shown as means ± SEM.

