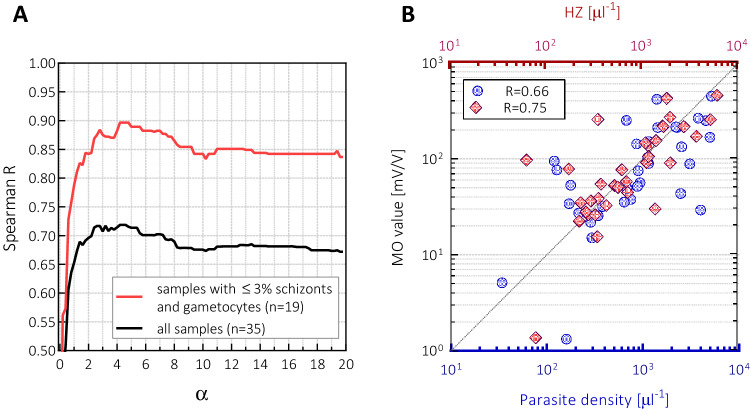
Figure 3.
(A) The Spearman rank correlation coefficient between the MO values and the estimated hemozoin content, , as the function of . The red curve shows the correlation coefficient calculated for the subset of samples in which the proportion of schizonts and gametocytes was below 3% (n = 19). The black curve shows the correlation coefficient for the full sample set (n = 35). (B) The MO values as the function of parasite density (bottom x-axis, blue circles) and as the function of HZ (top x-axis, red diamonds).The latter was calculated using the value (determined from the red curve in panel A), and also including the hemozoin contributions from schizonts and gametocytes, as described in the main text. The Spearman rank correlation coefficients for the two cases are also indicated.

