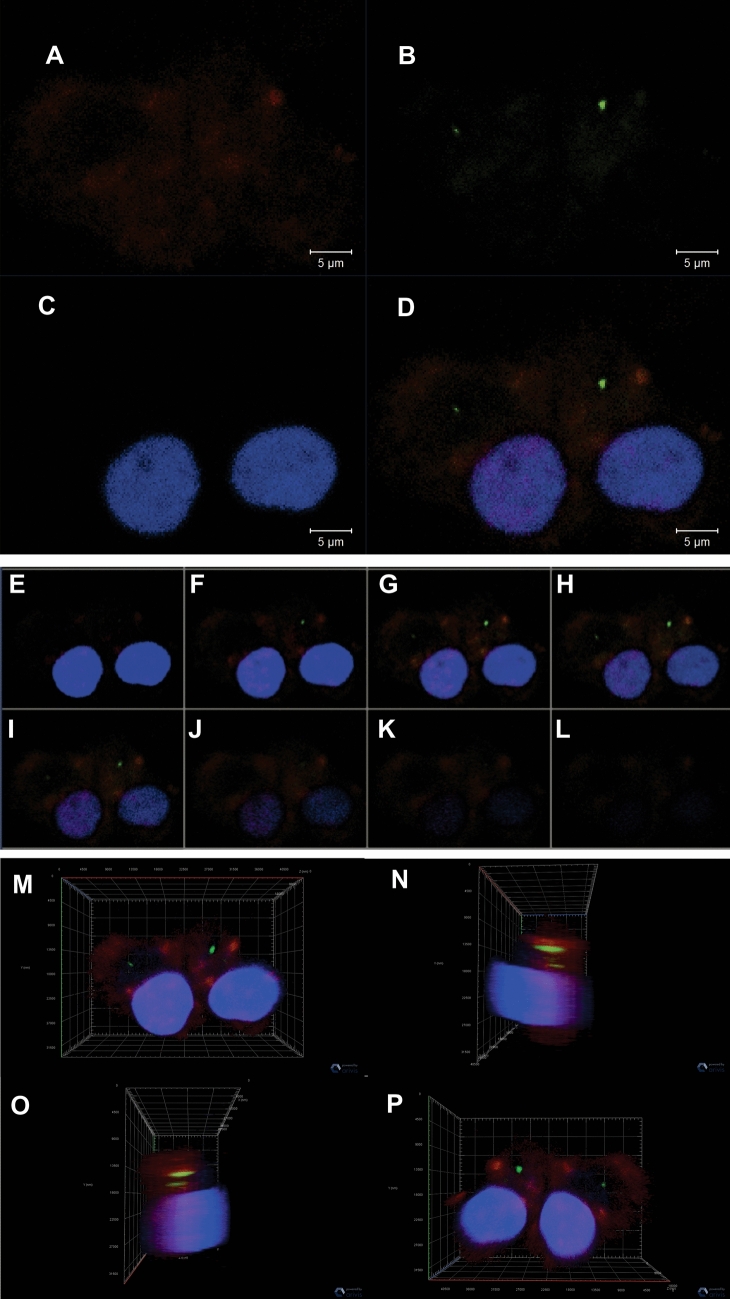
Figure 5.
Illustration of EV internalization by mDCs using confocal microscopy. (A) cells labeled with CD209 (red), a dendritic cell transmembrane antigen; (B) EVs stained with PKH67 (green); (C) nuclear staining with DAPI (blue); (D) Merge of CD209, DAPI and PKH67; (E–L) Sequential images using the z-stack tool of confocal microscopy depicting EVs inside the dendritic cells. Three-dimensional images of EVs and mDCs displayed in four angles of 45° displaying nuclei (blue), CD209 (red), EVs (green); (M) front view of the cells; (N) left lateral view of the cells; (O) right lateral view of the cells; (P) back view of the cells, indicating that the EVs were internalized by mono-DCs.

