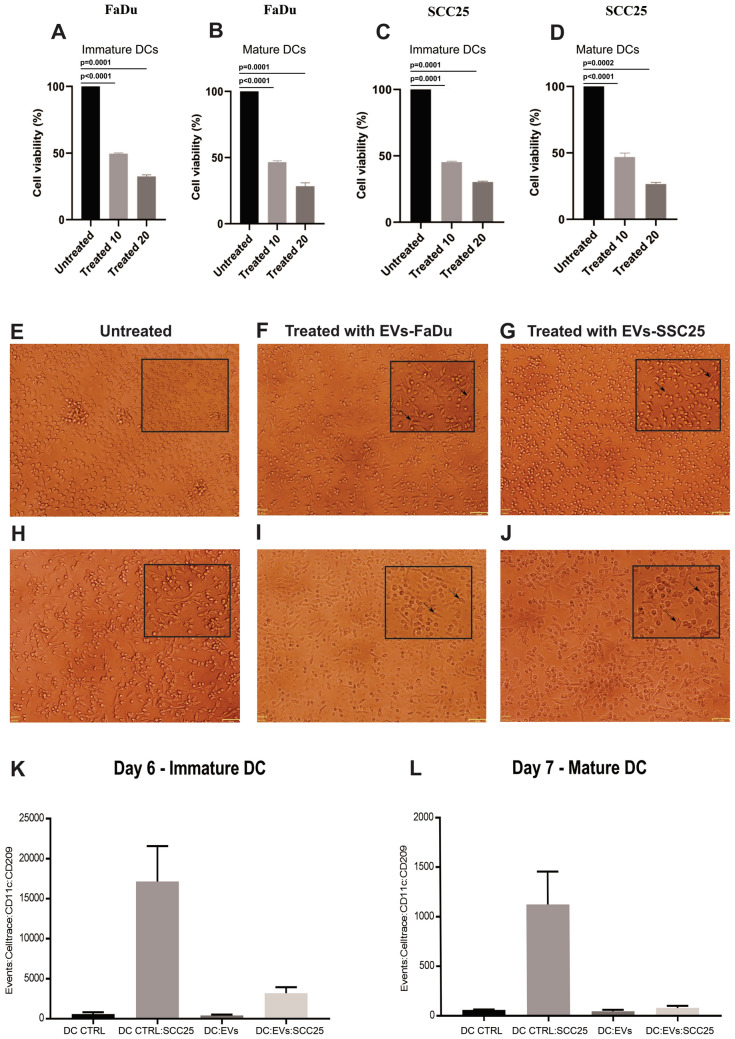
Figure 6.
Viability of DCs cultivated in the presence or absence of EVs. Viability of (A) iDCs and (B) mDCs treated with EVs from FaDu; (C) iDCs and (D) mDCs treated with EVs from SCC25. Two different concentrations of EVs were used. Representative results of n = 4 samples. Phase contrast microscopy of iDCs and mDCs cultivated in the presence or absence of EVs derived from FaDu or SCC25 cell lines. (E) untreated iDCs; (F) iDCs treated with FaDu EVs; (G) iDCs treated with SCC25 EVs; (H) untreated mDCs; (I) mDCs treated with FaDu EVs; (J) mDCs treated with SCC25 EVs (× 10 magnification). Details from each image were amplified and included as image inserts for better visualization of cells adhered to culture plates. Migration assay analysis. Violet CellTrace-stained iDCs (K) and mDCs (L) were detected in the lower chamber of the transwells. DC CTRL: untreated iDC or mDC; DC CTRL SCC25: untreated iDC or mDC placed in the transwell with SCC25 in the lower chamber; DCs EVs: iDC or mDC treated with EVs; DC EV SCC25: iDC or mDC treated with EVs placed in the transwell with SCC25 in the lower chamber. Diminished migration was observed for EV-treated iDCs (426 ± 27 cells) and mDCs (45 ± 16 cells) when compared with untreated DCs (controls), and this difference was even more evident when SCC25 cells were placed in the lower chamber: 3190 ± 764 treated iDCs migrated to the lower chamber and 79 ± 23 treated mDCS migrated to the lower chamber, compared with 17,153 ± 4411 untreated iDCs and 1125 ± 132 mDCs migrating in control assays. Representative results of n = 2 samples.

