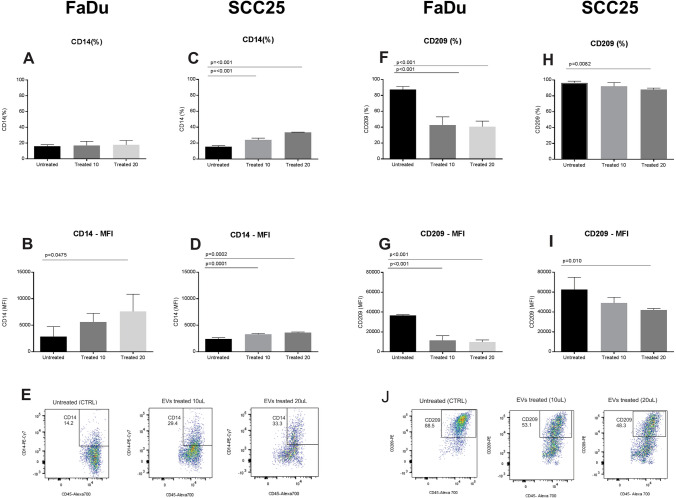
Figure 7.
Expression of CD14 and CD209 during dendritic cell differentiation in the presence and absence of EV. CD14 expression following treatment with FaDu cell line EVs: (A) There were no significant differences in the percentage of iDCs expressing CD14 between control (16.2% ± 1.8%) and EV treated cells (17.1 ± 5.3% and 17.9 ± 5.5%); (B) there were significant differences in the mean intensity of fluorescence (MFI) of CD14 in iDCs between the control (2884 ± 1857) and EV treated samples (5636 ± 1613 and 7605 ± 3265) depending of EV concentration. CD14 expression following treatment with SCC25 cell line EVs: (C) There were significant differences in the percentage of iDCs expressing CD14 between the control (15.5 ± 1.3%) and EV treated cells (24.0 ± 2.3% and 33.5 ± 0.3%) depending on EV concentration; (D) there were significant differences in CD14 MFI between control (2402 ± 253) and EV treated cells (3275 ± 170 and 3623 + 111) depending on EV concentration; (E) Representative dot plots displaying iDCs expressing CD14 on day 6 of culture without treatment (CTRL) and EV-treated cells. CD209 expression following treatment with FaDu cell line EVs: (F) There were significant differences in the percentage of iDCs expressing CD209 between control (87.4 ± 3.8%) and EV treated cells (42.8 ± 10.2% and 40.5 ± 7.1%); (G) there were differences between untreated iDCs MFI (36,670 ± 802) and treated iDCs (11,543 + 4719 and 9900 ± 2034). CD209 expression following treatment with SCC25 cell line EVs: (H) there were significant differences in iDCs expressing CD209, between the control (96.5 ± 2.1%) and treated cells (92 ± 4.8% and 87.9 ± 1.9%), depending on EV concentration; (I) there were differences between untreated iDCs MFI (62,514 + 12,407) and treated cells (49,110 ± 5632 and 42,011 ± 1568) (n = 4); (J) Representative dot plot graphs displaying iDCs expressing CD209 on day 6 of culture without treatment (CTRL) and EV-treated cells with different concentrations of EVs. Representative results of n = 4 samples per lineage type. The statistical analysis was performed using one way ANOVA with Dunnett correction.

