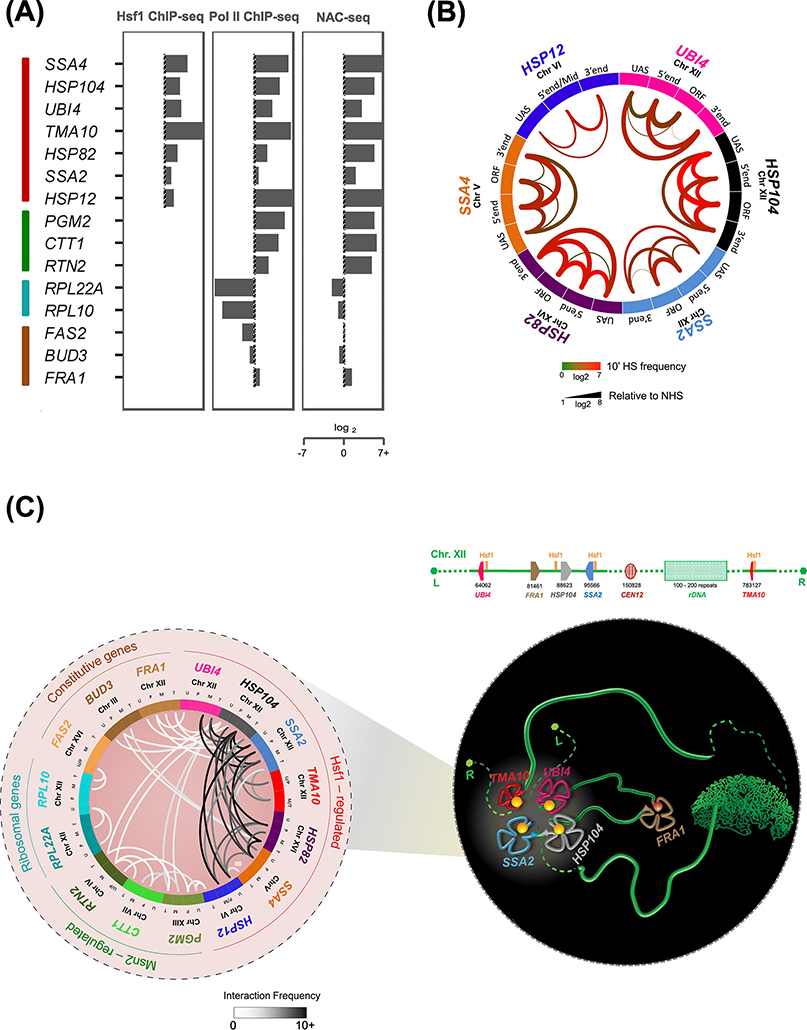
Figure 2. Hsf1-regulated Genes in S. cerevisiae Loop, Crumple and Coalesce upon Transcriptional Activation.
A) Fold-change nascent RNA, Pol II and Hsf1 densities at representative genes (heat shock-inducible: Hsf1- and Msn2/4-regulated (red and green); heat shock-repressed: ribosomal protein coding (RPL; blue); and constitutively expressed (brown) in budding yeast. Log2 fold-change levels are calculated at 5 min HS relative to NHS. NAC-seq and Hsf1 ChIP-seq data were derived from [37] and Rpb1 ChIP-seq data from [61].
B) Circos plot depicting intragenic interactions within indicated Hsf1-target genes as determined by Taq I-3C. Data were obtained from NHS and 10 min HS-induced cells [7, 9]. Arcs depict chromatin interactions between indicated gene regions. Color of each arc reflects the interaction frequency detected under 10 min HS conditions; thickness represents fold-change of HS relative to NHS.
C)(Left) Circos plot depicting intergenic interactions detected between the indicated genes in acutely heat-shocked cells by Taq I-3C [7, 9]. Arcs depict chromatin interactions between indicated genic regions; shade is proportional to the frequency of interaction. For each gene pair, top two interaction frequencies are shown. U, UAS; P, promoter; M, mid-ORF region; T, terminator. (Right) Schematic model of Chromosome XII (green ribbon-like structure), depicting heat shock-driven interactions between Hsf1-target genes. UBI4, HSP104 and SSA2 on the left arm physically interact with TMA10 located on the right arm, circumventing the physical barrier imposed by the nucleolus (green crescent shaped structure). In contrast, FRA1, a constitutively active gene interposed between UBI4 and HSP104, is excluded from coalescence. L, left telomere; R, right telomere. Physical map is shown above.

