
FIGURE 4.
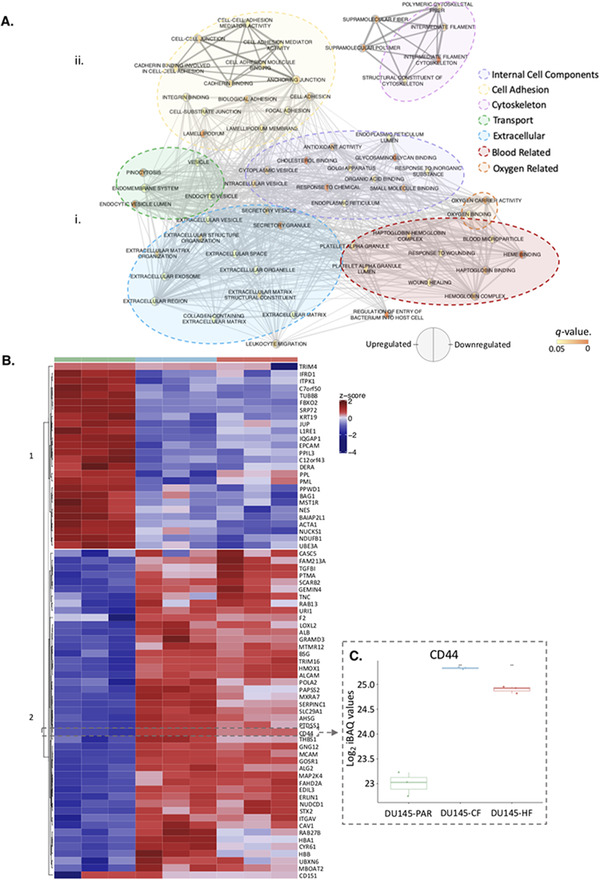
Proteins identified to be enriched in radiation resistance. A. Pathway enrichment analysis performed using g:Profiler on the (i) significantly downregulated and (ii) significantly upregulated proteins in Figure S3 Large clusters of similar pathways are outlined as internal cell components (purple), cell adhesion (yellow), cytoskeleton (pink), transport (green), extracellular (blue), blood related (red) and oxygen related (orange). B. Heatmap showing the 72 radiation resistant proteins which had a significant change in expression (represented as circles in (Figure S3 . Hard clustering was applied, with an optimum km = 2 identified. CD44, a protein of interest, has been manually highlighted. C. Log2 normalized iBAQ values for CD44 in DU145‐PAR (green), DU145‐CF (blue), and DU145‐HF (red). Statistics were performed using Student's t‐test. p values < 0.05 was considered statistically significant