. 2021 Jul 1;27(18):5109–5122. doi: 10.1158/1078-0432.CCR-21-0553

Figure 4.

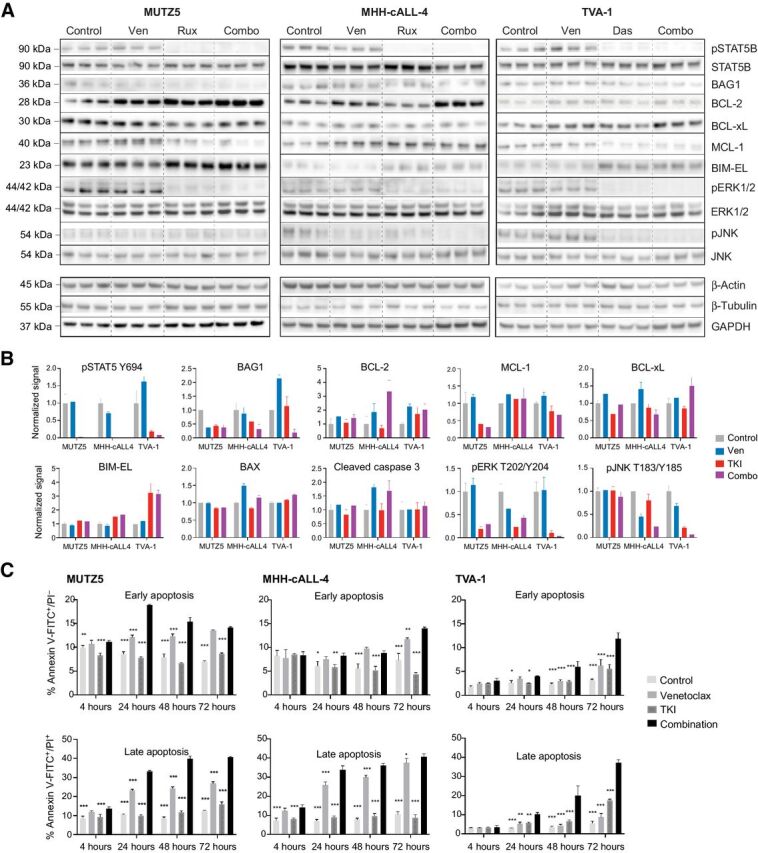
Figure 4. Effects of combined kinase and BCL-2 inhibition on intracellular phosphosignaling, apoptosis proteins, and functional apoptosis. A, Immunoblot images and (B) normalized immunoblotting signal intensities of phosphorylated (p) STAT5, pERK, and pJNK (along with total protein levels below their respective phosphoprotein levels), and BAG1 and BCL-2 family proteins in Ph-like ALL cell lines treated in vitro with single-agent venetoclax, single-agent TKI (ruxolitinib for MUTZ5 and MHH-cALL-4, dasatinib for TVA-1), or both drugs. Densitometry signals were first normalized to either β-actin, β-tubulin, or GAPDH loading controls (representative strips shown) and displayed graphically relative to 0.1% DMSO control treatment. Each bar represents mean ± SD of three technical replicates. BAX and cleaved caspase-3 targets were assessed by apoptosis protein arrays. C, Time course of apoptosis under single or combination drug conditions was assessed by annexin V/propidium iodide (PI) co-staining and flow cytometric analysis. MUTZ5 and MHH-cALL-4 cells were treated with 0.1 μmol/L venetoclax, 1 μmol/L ruxolitinib, both drugs, or 0.1% DMSO control. TVA-1 cells were treated with 50 nmol/L venetoclax, 0.5 nmol/L dasatinib, both drugs, or 0.1% DMSO control. Early apoptosis (assessed by percent annexin V+/PI−, left) and late apoptosis/necrosis (assessed by percent annexin V+/PI+, right) are shown for each time point. Each bar represents mean ± SD of three replicates. Significance of control or single drug as compared with combination indicated by asterisks above bars: *P ≤ 0.05, **P ≤ 0.01, ***P ≤ 0.001 using two-way ANOVA and Dunnett post-test correction.

Effects of combined kinase and BCL-2 inhibition on intracellular phosphosignaling, apoptosis proteins, and functional apoptosis. A, Immunoblot images and (B) normalized immunoblotting signal intensities of phosphorylated (p) STAT5, pERK, and pJNK (along with total protein levels below their respective phosphoprotein levels), and BAG1 and BCL-2 family proteins in Ph-like ALL cell lines treated in vitro with single-agent venetoclax, single-agent TKI (ruxolitinib for MUTZ5 and MHH-cALL-4, dasatinib for TVA-1), or both drugs. Densitometry signals were first normalized to either β-actin, β-tubulin, or GAPDH loading controls (representative strips shown) and displayed graphically relative to 0.1% DMSO control treatment. Each bar represents mean ± SD of three technical replicates. BAX and cleaved caspase-3 targets were assessed by apoptosis protein arrays. C, Time course of apoptosis under single or combination drug conditions was assessed by annexin V/propidium iodide (PI) co-staining and flow cytometric analysis. MUTZ5 and MHH-cALL-4 cells were treated with 0.1 μmol/L venetoclax, 1 μmol/L ruxolitinib, both drugs, or 0.1% DMSO control. TVA-1 cells were treated with 50 nmol/L venetoclax, 0.5 nmol/L dasatinib, both drugs, or 0.1% DMSO control. Early apoptosis (assessed by percent annexin V+/PI−, left) and late apoptosis/necrosis (assessed by percent annexin V+/PI+, right) are shown for each time point. Each bar represents mean ± SD of three replicates. Significance of control or single drug as compared with combination indicated by asterisks above bars: *P ≤ 0.05, **P ≤ 0.01, ***P ≤ 0.001 using two-way ANOVA and Dunnett post-test correction.