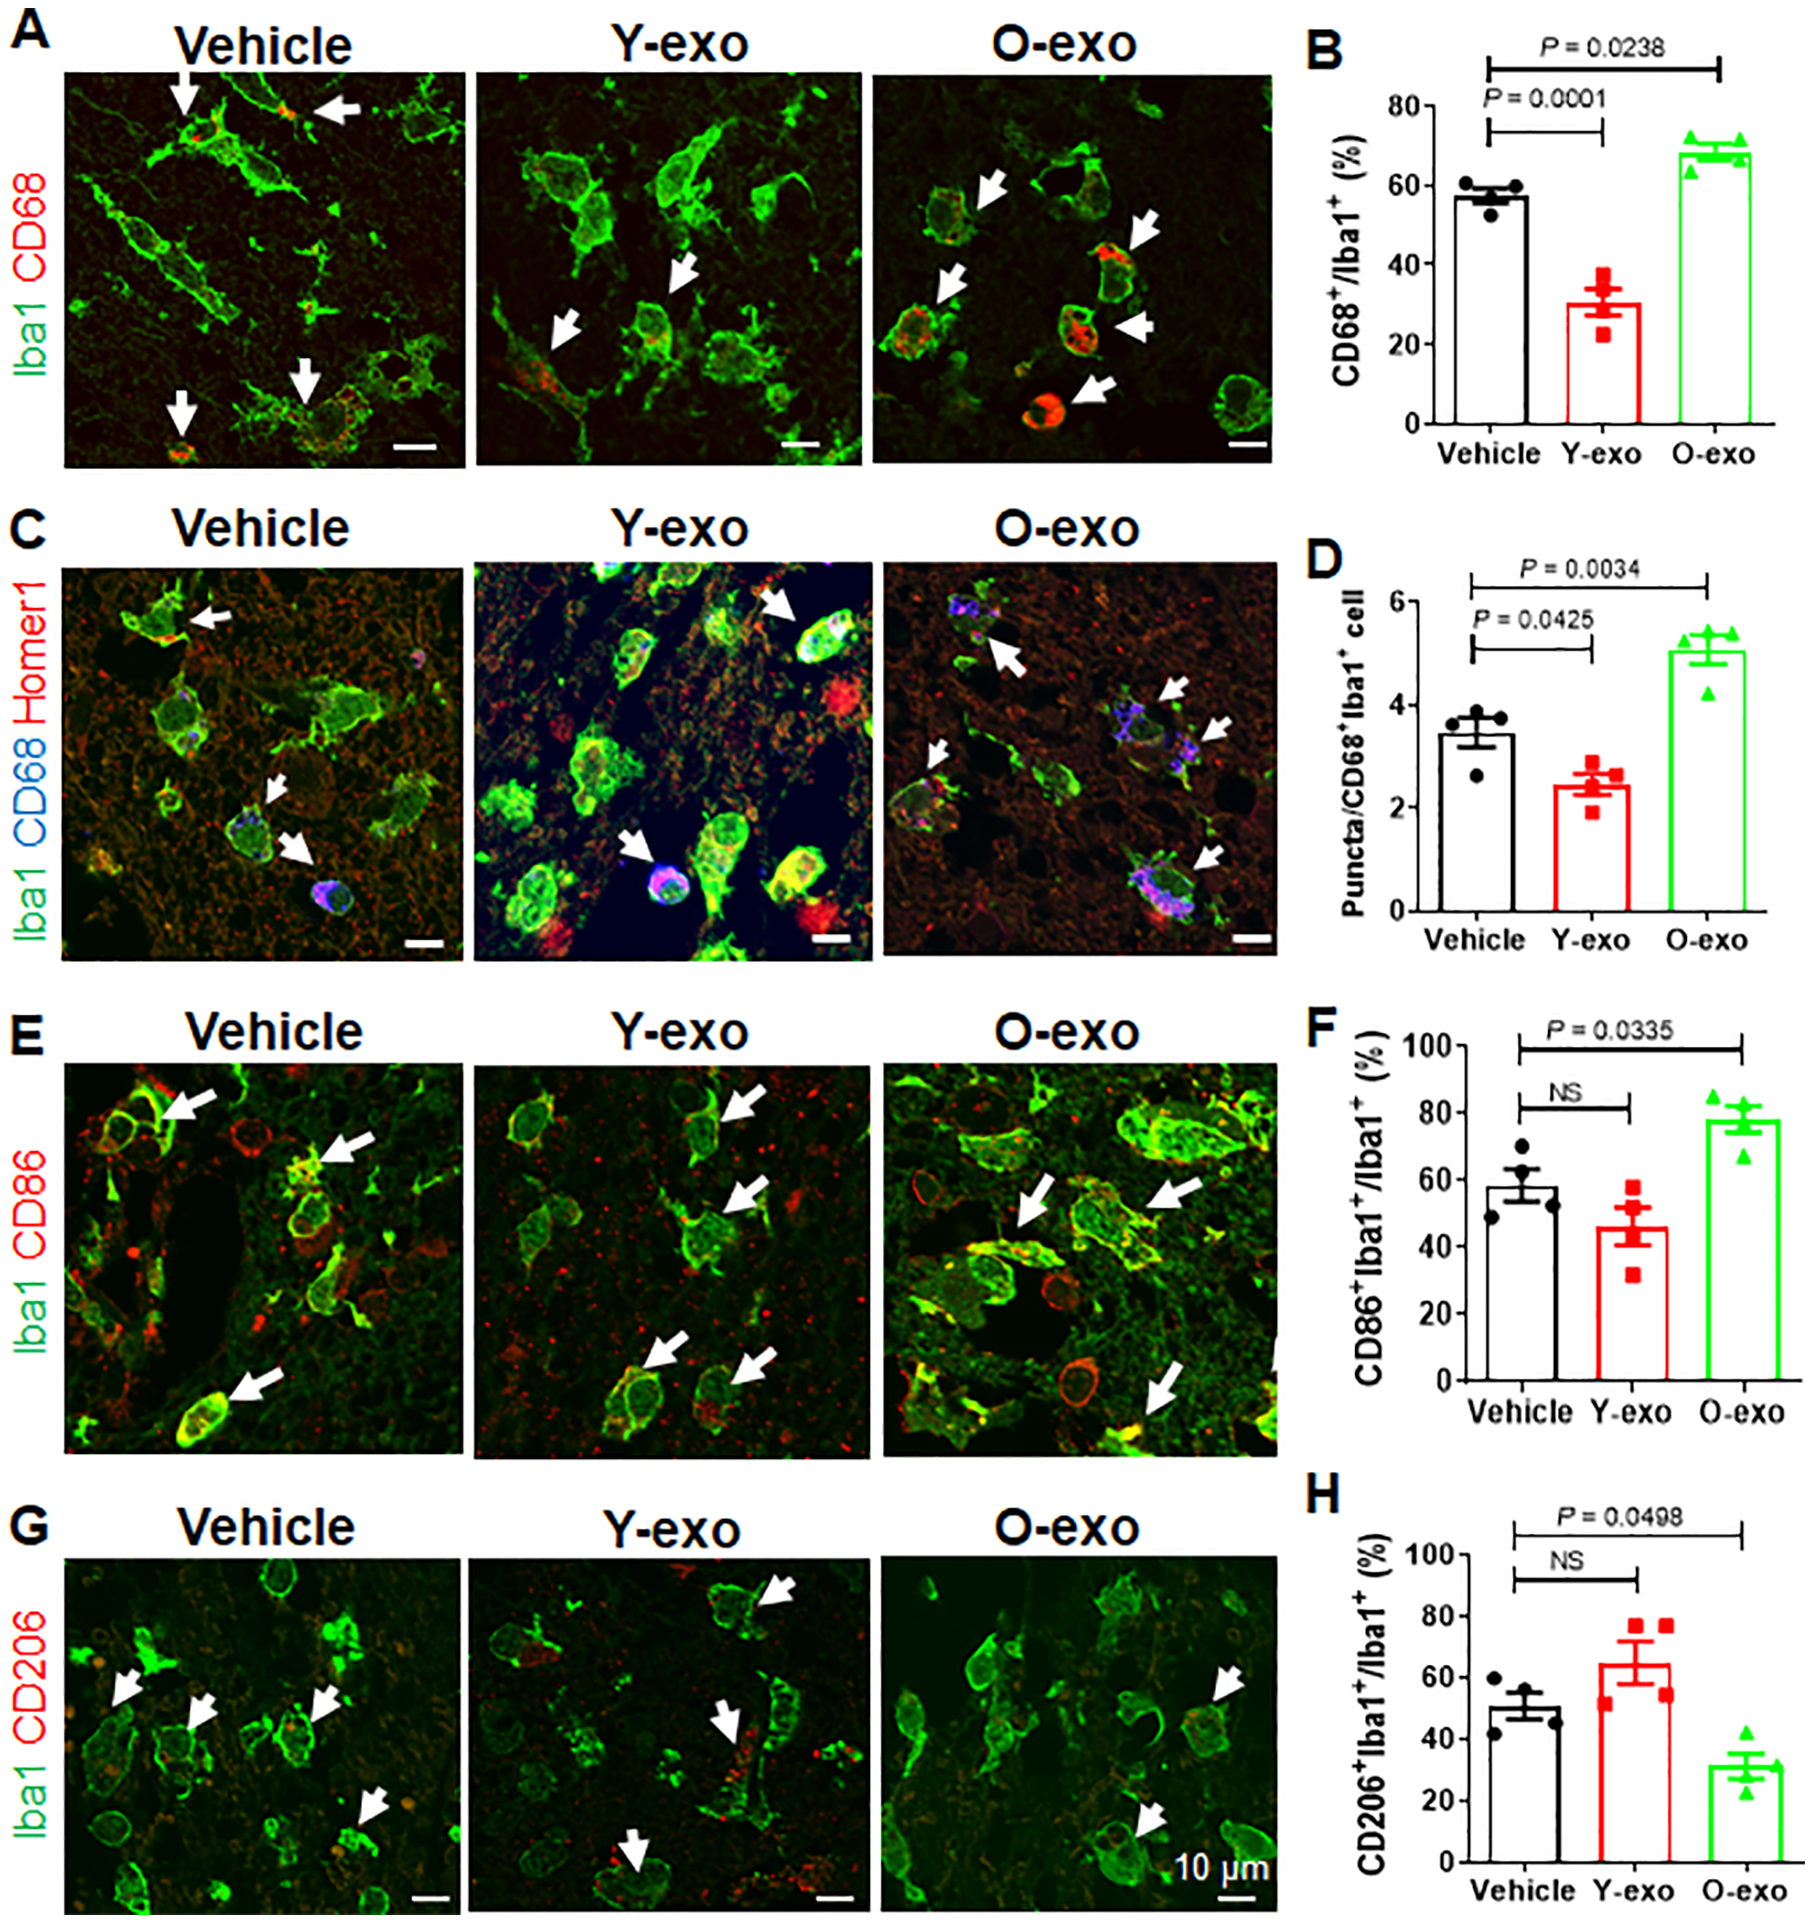
Figure 3. Serum exosomes prime the microglia response after ischemic stroke.

A. Representative confocal images of Iba1+(green)CD68+(red) microglia in the M1 region of the penumbra in aged ischemic rats treated with vehicle, Y-exo or O-exo. White arrows indicate Iba1+CD68+ microglia. B. Quantitative analysis of Iba1+CD68+ microglia in the penumbra in vehicle-, Y-exo– and O-exo–treated aged rats 72 h after dMCAO. C. Representative confocal images of Iba1+ (green), CD68+ (blue) and Homer1+ (red) microglia in the penumbra after vehicle, Y-exo or O-exo treatment. D. Quantification of the phagocytic response of microglia in the M1 region of the penumbra in aged ischemic rats after vehicle, Y-exo or O-exo treatment. E. Representative confocal images from the penumbra (M1 region) showing expression of Iba1 (green) and CD86 (red) after serum exosome treatment. White arrows indicate Iba1+CD86+ microglia. F. Quantification of Iba1+CD86+ microglia in vehicle-, Y-exo– or O-exo–treated ischemic rats. G. Representative confocal images of Iba1 (green) and CD206 (red) in the penumbra of the aged ischemic brain after serum exosome treatment. White arrows indicate Iba1+CD206+ microglia. H. The number of CD206+ microglia in the penumbra after vehicle, Y-exo or O-exo treatment. Each data point in the bar plots represents a biological replicate. Data are presented as the mean ± SEM. The P values were assessed by a one-way ANOVA with a Dunnett’s post-hoc test in all panels. NS stands for not significant. Y-exo, serum exosomes from young rats; O-exo, serum exosomes from aged rats.
