
Figure 5. Microglial depletion reverses O-exo–mediated detrimental impairments in synaptic and sensorimotor function.
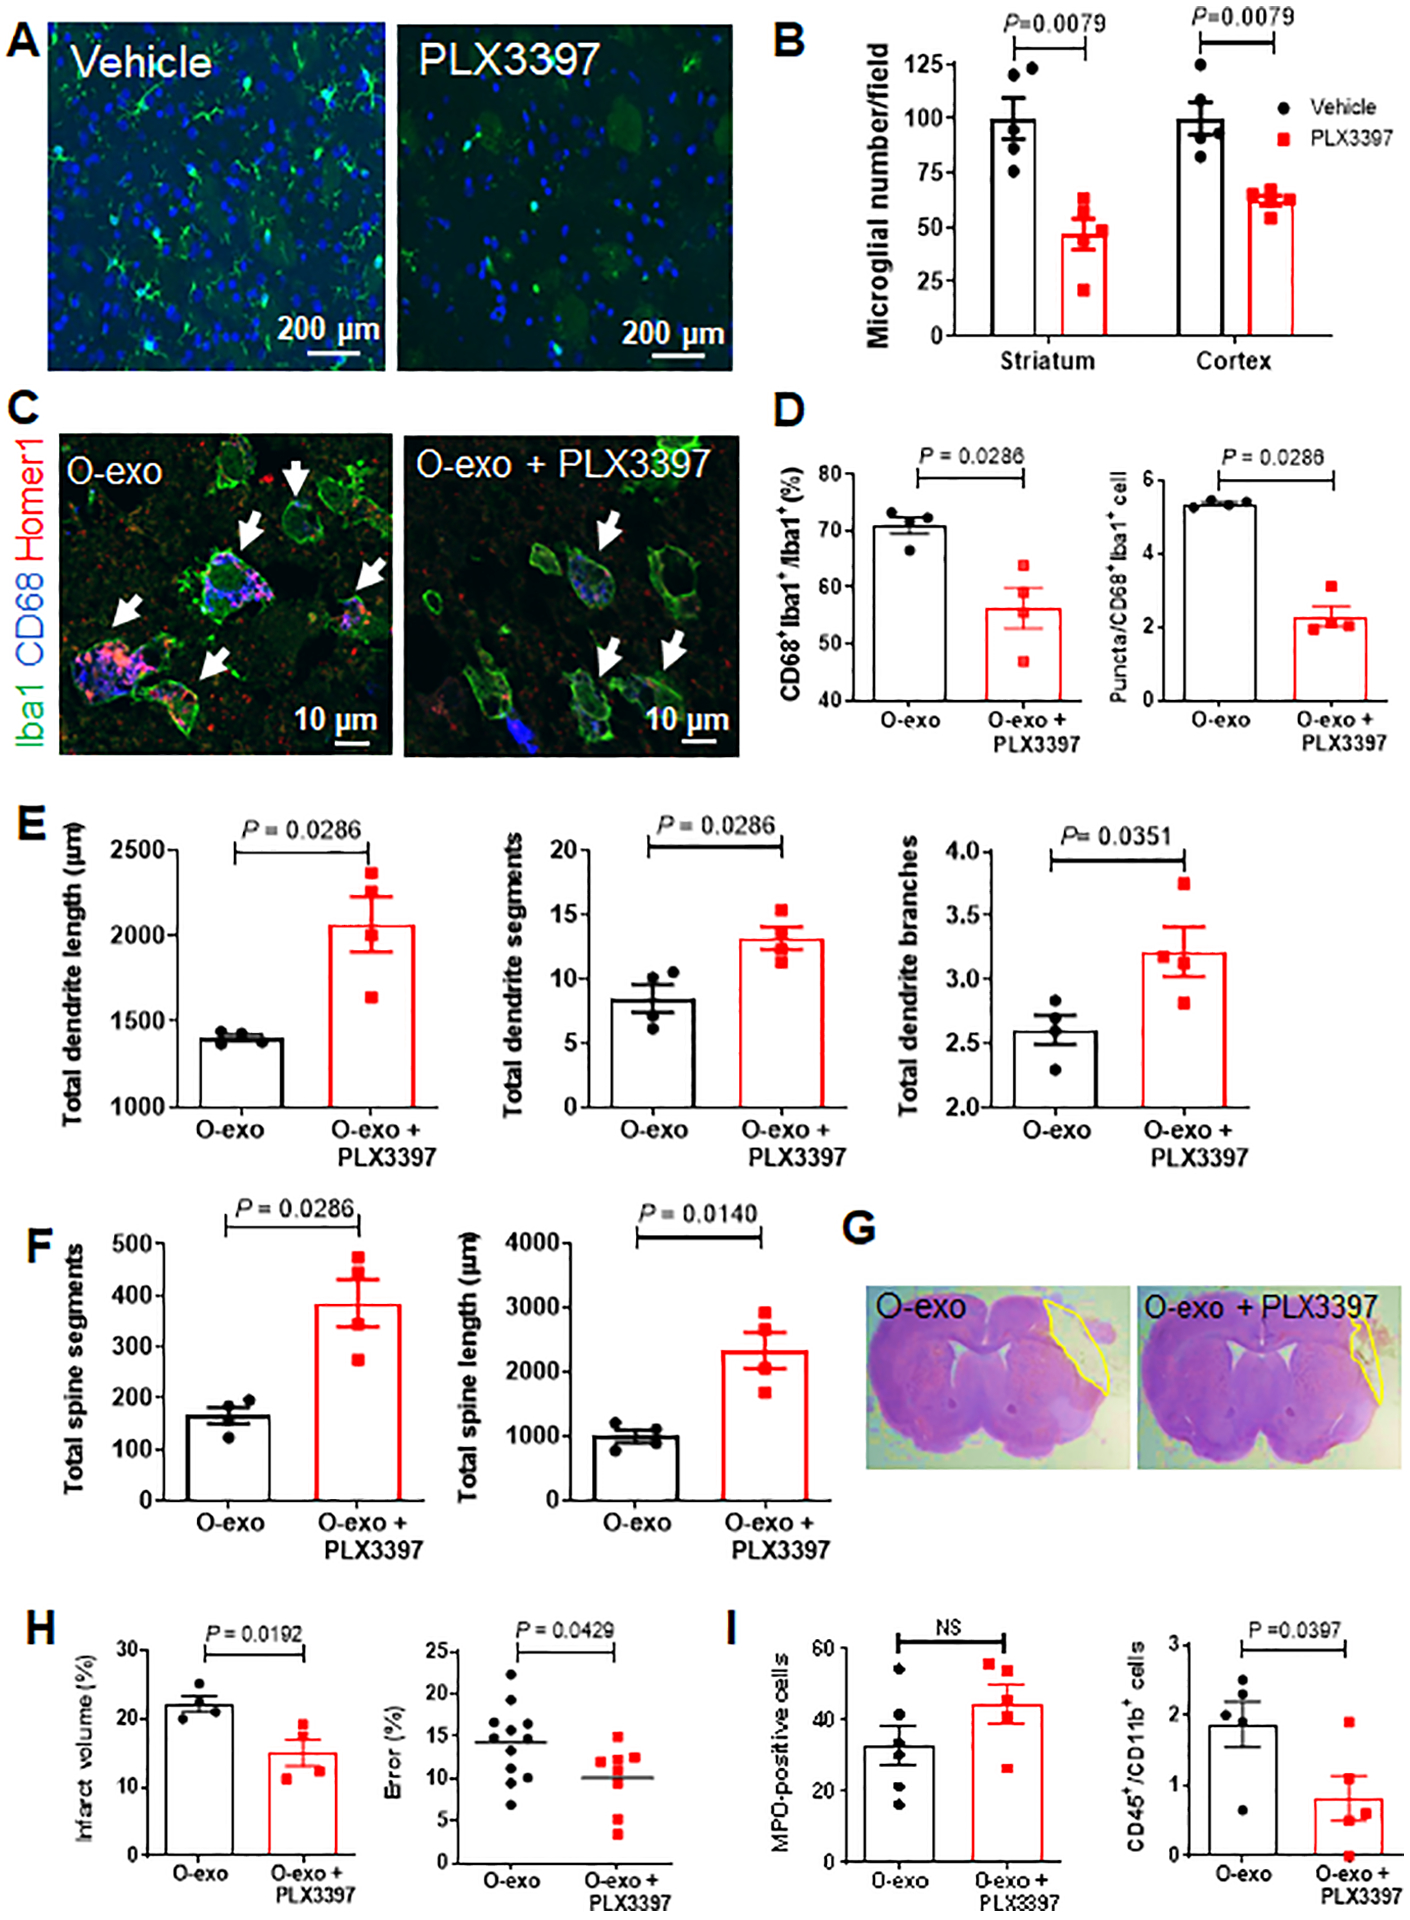
A. Representative images of brain sections from aged rats immunostained for Iba1 (green) after being fed a PLX3397-containing diet or a standard diet for 28 days. DAPI was used as a nuclear counterstain (blue). B. Quantitative analysis of Iba1+ cells in the striatum and cortex of healthy aged rats treated with PLX3397 or vehicle (N = 5 per group). The P values were assessed by a Mann-Whitney tests. C. Representative confocal images of cells in the penumbral M1 region immunostained for Iba1 (green), CD68 (blue) and Homer1 (red) after treatment with O-exo alone or O-exo + PLX3397 for 3 days. White arrows indicate Iba1+CD68+Homer1+ microglia. D. Quantitative analysis of Iba1+CD68+ cells (left panel) and the number of puncta in each activated microglia (right panel) in the penumbra of aged ischemic rats treated with O-exo alone or O-exo + PLX3397 for 3 days (N = 4 per group). The P values were assessed by a Mann-Whitney test. E and F. Quantitative analysis of the effects of O-exo on total dendritic length (E), branches and segments and total spine length and segments (F) in aged ischemic rats fed a PLX3397-containing diet or a standard diet. N = 4 per group. P values were shown and assessed by Mann-Whitney tests for all panels in E and F. G. Representative images of CV–stained brain sections of aged ischemic rats treated with O-exo alone or O-exo + PLX3397 for 3 days. H. Quantification of infarct volume (left panel; N = 4 per group) and sensorimotor deficits (ladder rung walking test; right panel; N = 12 in the O-exo group and N = 8 in the O-exo + PLX3397 group) in aged ischemic rats fed a PLX3397-containing diet or a standard diet at 3 days after treatment with O-exo. The infarct volume was analyzed by a Mann-Whitney test. The sensorimotor deficits were analyzed by an unpaired Student’s t-test. I. Quantitative analysis of MPO+ cells (left panel) at 20× magnification and CD45+CD11b+ monocytes (right panel) in the penumbral M1 regions of aged ischemic rats fed a PLX3397-containing diet or a standard diet followed O-exo treatment. The data are shown as mean ± SEM (N = 5 per group). The P values were assessed by a Mann-Whitney tests. NS stands for not significant. O-exo, serum exosomes from aged rats.