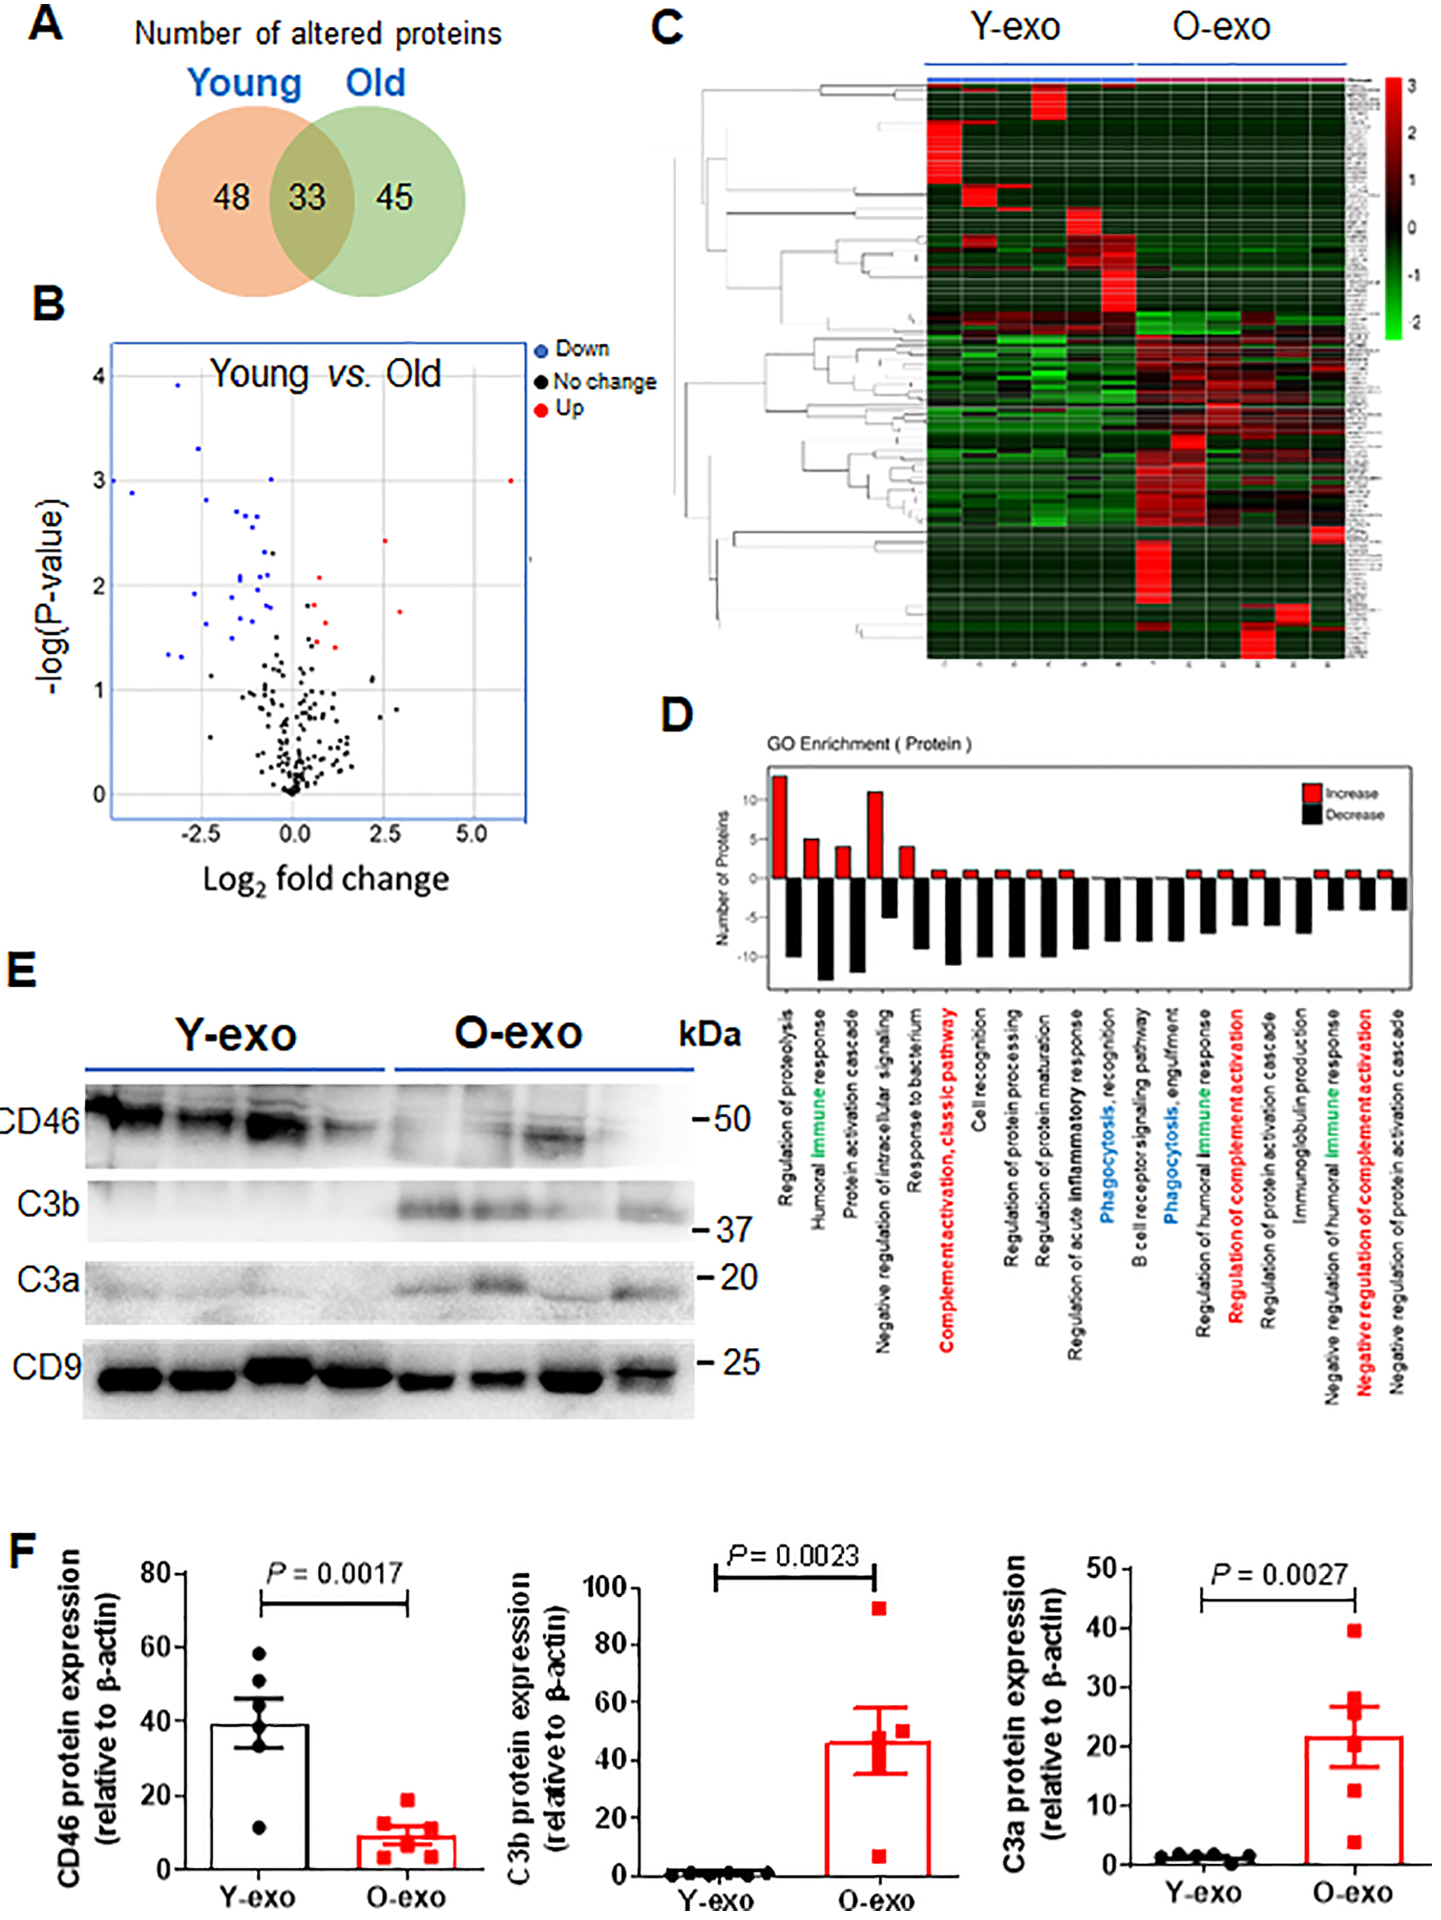
Figure 6. Proteomic profiles of Y-exo and O-exo.

A. Venn diagram depicts the overlap of the altered serum exosome proteins between normal young and aged rats as determined by proteomics. A total of 126 proteins were significantly different between Y-exo and O-exo. Among these, 48 and 45 proteins were expressed only in Y-exo and O-exo, respectively. B. Volcano plot displaying the distribution of identified serum exosome protein changes with age and significance (N = 6 per group). The data were analyzed by a Fisher’s exact test. C. Heatmap representation of significantly changed proteins. Fold change values > 1.5 and a p-value < 0.05 were set as the filter criteria (N = 6 per group). The data were analyzed by a Fisher’s exact test. D. A GO enrichment analysis for biological processes of up-regulated (red) and down-regulated (black) proteins in Y-exo was performed. Immune, complement cascade and phagocytosis in the GO categories are indicated by green, red and blue, respectively. E. Western blot analysis of Y-exo and O-exo using antibodies against CD46, C3b and C3a. C9 was used as a protein control for protein loading and normalization of protein levels. F. The expression levels of selected proteins detected by Western blot were normalized to the β-actin level of the same sample. Data represent the mean ± SEM (N = 6 biological replicates for the Y-exo and O-exo groups) using unpaired two-tailed Student’s t-test. Each experiment was repeated three times with similar results. The data are shown as mean ± SEM. Y-exo, serum exosomes from young rats; O-exo, serum exosomes from aged rats.
