
Figure 3.
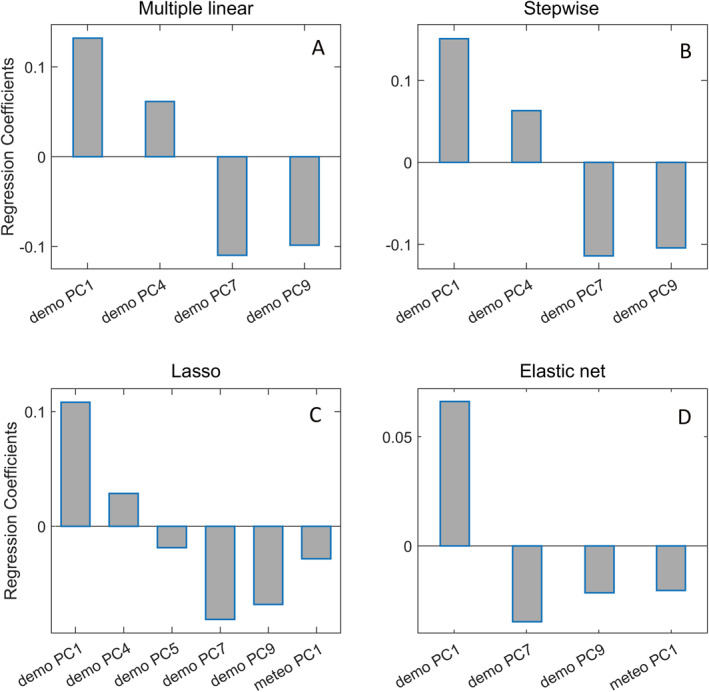
Results of: (a) multiple linear regression (“custom”) method, (b) Stepwise regression, (c) Lasso regression, and (d) Elastic net regression. Bar charts represent the values of regression coefficients for each of the PCs selected by the method.