
FIGURE 1.
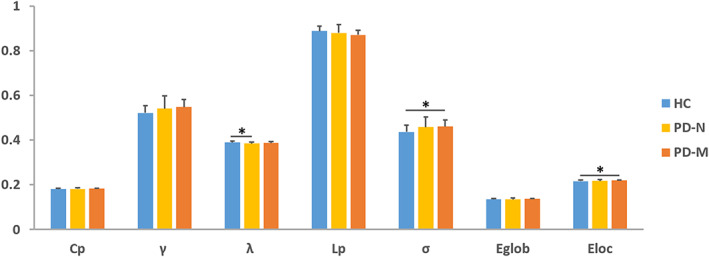
Global network properties among the PD‐M, PD‐N, and HC groups. The bar graph shows the area under the curve of the global network parameters among the 3 groups. Error bars denote SD. Black asterisks indicate significant differences in the post hoc comparisons. Abbreviations: PD, Parkinson's disease; PD‐M, PD with mild cognitive impairment; PD‐N, PD with normal cognition; HC, healthy control; C p, clustering coefficient; γ, normalized clustering coefficient; L p, characteristic path length; λ, normalized characteristic path length; E loc, local efficiency; E glob, global efficiency; σ, small‐worldness