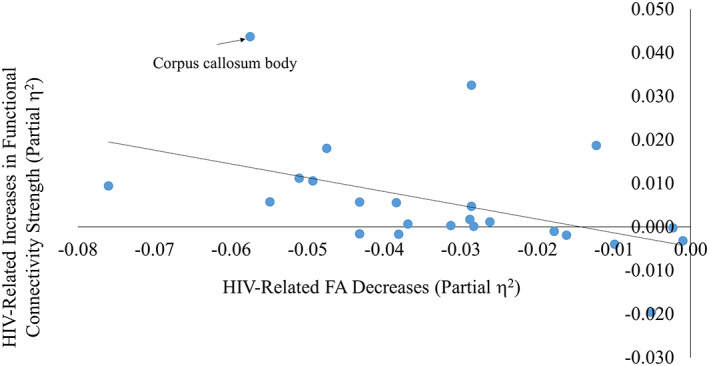
FIGURE 1.

Human immunodeficiency virus (HIV)‐related changes in fractional anisotropy (FA) versus HIV‐related changes in functional connectivity. The effect size of HIV‐related FA degradation in all tracts (measured by partial η 2) is plotted against the effect size of HIV‐related increases in functional connectivity strength in all tracts (measured by partial η 2). Each point represents one of the 24 white matter tract groups. Positive values represent HIV‐related increases in FA and functional connectivity strength, and negative values represent HIV‐related decreases in the same. The corpus callosum body is on the extreme end of both measures
