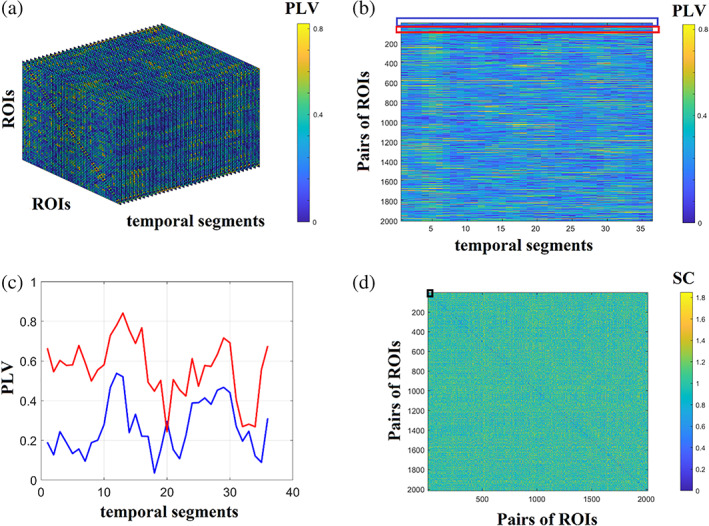
FIGURE 10.

Schematic step by step construction of an edge‐to‐edge functional brain network. (a) An example of a 3D dynamic functional connectivity brain network. (b) A vectorised version of the 3D dynamic functional connectivity brain network into a 2D representation of temporal functional strength. (c) An example of temporal functional strengths for two pairs of pairs of ROIs . (d) The final edge‐to‐edge functional connectivity network estimated via spearman's correlation of every pair of temporal functional strength tabulated in the 2D matrix showed in B in total. Black box points the position of spearman correlation between the two temporal functional strength showed in C (PLV, phase locking value; SC, spearman's correlation)
