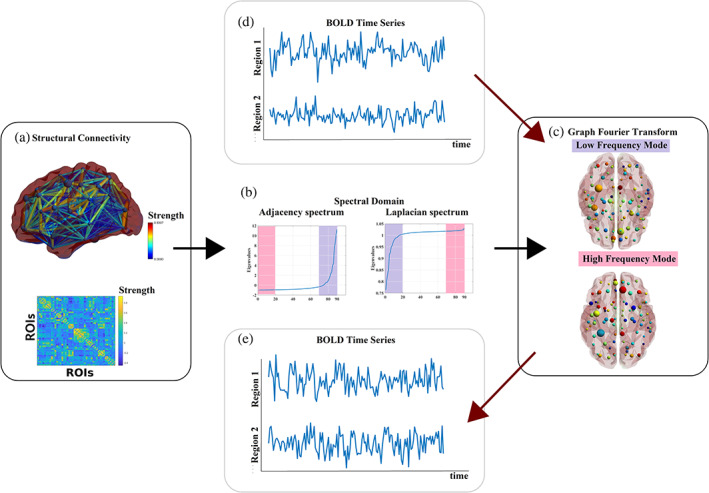
FIGURE 13.

Graph signal processing for brain imaging. (a) Visualisation of a weighted structural connectivity graph derived from diffusion MRI in a sagittal brain view (top) and as an adjacency matrix of size () where every edge (topography) or cell (adjacency) represents the strength of the structural connection. Here, we adopted a healthy subject of age 24. The matrix has been constructed as described in a recent study (Dimitriadis et al., 2017). (b) Τhe eigendecomposition of the adjacency (left plot) and normalised Laplacian (right plot) matrix revealed the related eigenvalues, and it is linked to the spectral analysis of a graph like the Fourier transform of a time series. The smallest (most positive) Laplacian eigenvalues (labelled in lilac) are associated with low‐frequency modes of the graph (c, top brain view). In contrast, the largest (most negative) Laplacian eigenvalues (or most negative adjacency eigenvalues) (labelled in pink) are associated with high‐frequency modes (c, bottom brain views). Both modes define the graph Fourier transform (GFT). Functional MRI data or EEG or MEG measured at every single ROI representing the nodes of the graph (network) (d) can be decomposed employing these modes and can be transformed through graph signal processing (GSP) tools (e). Topographies have been created with BrainNet Viewer (Xia et al., 2013)
