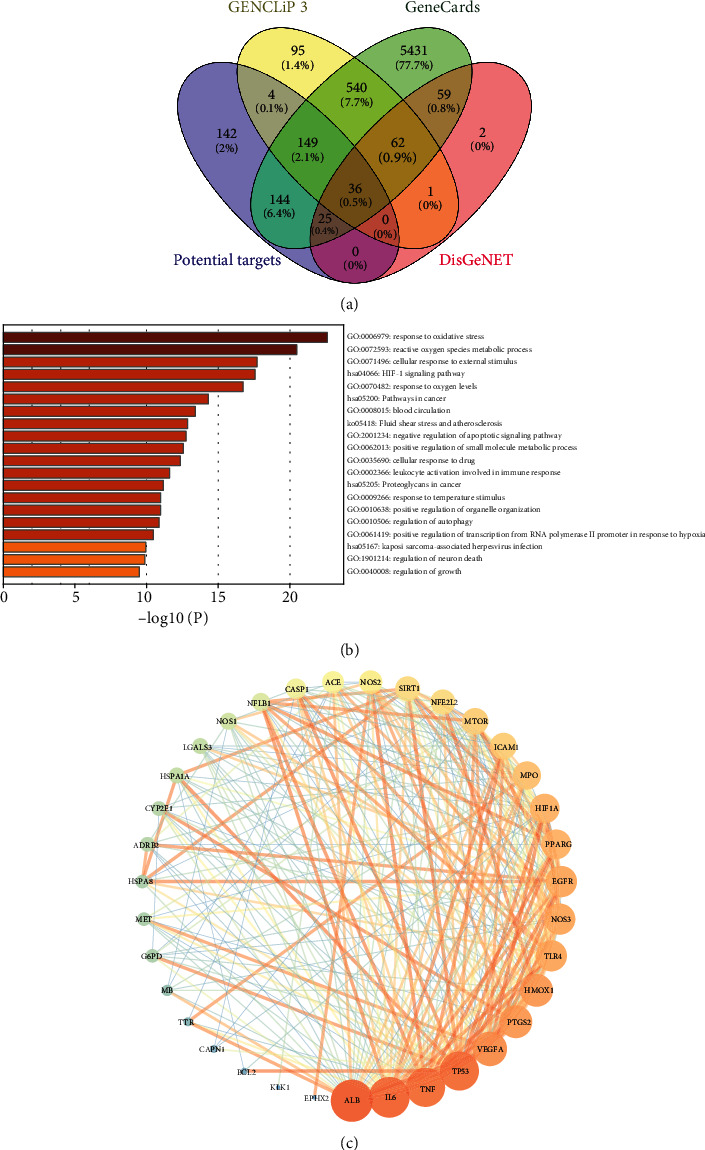
Figure 3.

Target identification of XXD on AKI and analysis. (a) The Venn diagram of the targets in both XXD targets and AKI targets. (b) The GO-BP and KEGG pathway enrichment analyses of 36 involved targets in XXD. (c) The PPI network analysis of 35 potential targets. Node size and color are proportional to the target degree in the network.
