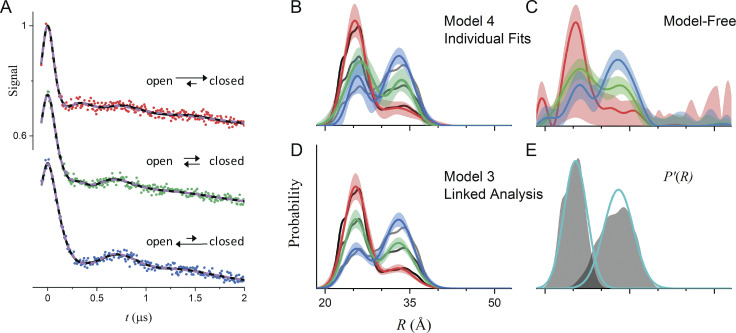
Figure 4.
Global analysis of simulated DEER data. (A) The data (filled circles) were simulated for P(R) modeled as the sum of two components using the amplitudes in Table 3. The true P'(R) of the components are distributions 5347 and 483 from the set of distributions calculated by Edwards and Stoll (2018) using MMM (Jeschke, 2018b) for T4L labeled at 118/154 and 8/126 with means/SDs of 25.1/1.9 Å and 32.6/3.0 Å, respectively. The best-fit lines for model 3 (R0 and σR values linked) and model 4 (no parameters linked) are shown as solid black and dashed colored lines, respectively. (B) P(R) for model 4 for datasets A (red), B (green), and C (blue) with the associated 2σ (95%) confidence bands as shaded regions. The black lines are the true P(R) used for the simulations. (C) Best-fit P(R) from Tikhonov regularization using DeerLab version 0.13.2 using the same color scheme. The optimal regularization factor was determined by generalized cross-validation. (D) Best-fit P(R) for model 3 using the same color scheme with the associated 2σ (95%) confidence bands as the shaded regions. The black lines are the true P(R) used for the simulations. (E) The P'(R) obtained for model 3 is shown in cyan, and the true P'(R) used for the simulations is superimposed as shaded regions. Both the x and y axis scales are the same for B–E.

