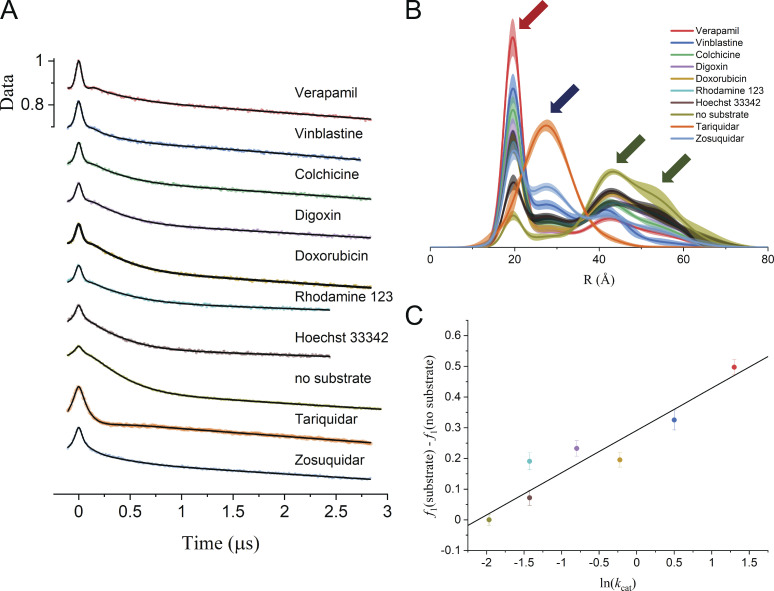
Figure 6.
Global analysis of Q-band DEER data for Pgp spin labeled with MTSSL at residues 511 and 1043. (A) Samples were prepared in mixed micelles with ATP and Vi in the presence and absence of substrates and inhibitors as indicated (Dastvan et al., 2019). The scaled data are shown as filled colored circles, and the best fits obtained from global analysis using model 2 (Table 5) are shown as solid black lines. (B) The best-distance distributions obtained using model 2 to fit the Pgp data with the associated 2σ (95%) confidence bands as shaded regions. The R0 values of the four components are indicated by the arrows. (C) The substrate-induced population of the shortest distance component is correlated with the activation energy of ATP turnover.

