Figure 8.
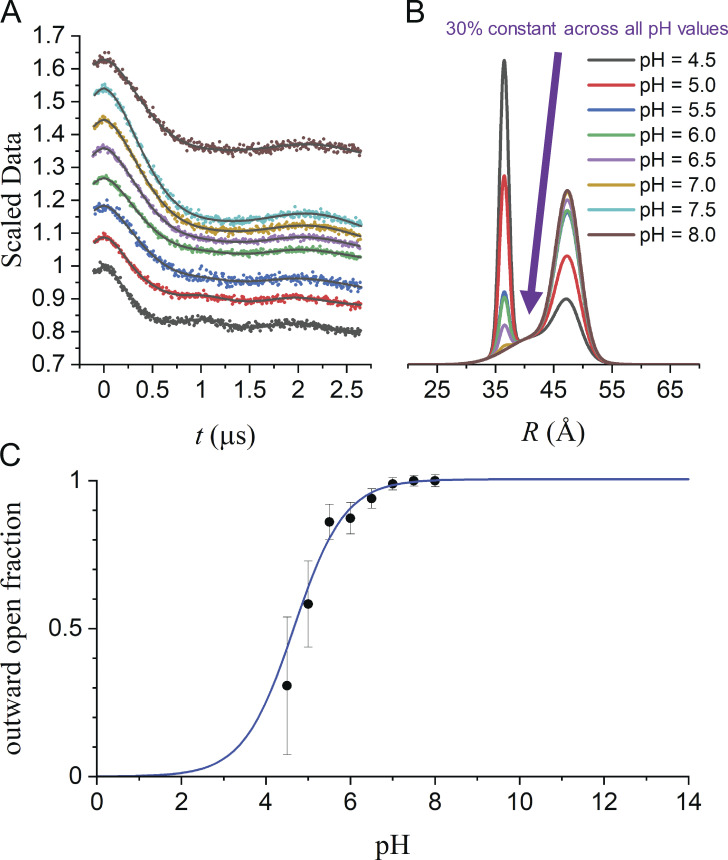
Global analysis of Q-band DEER data for LmrP spin labeled with MTSSL at residues 160 and 310. Related to Masureel et al. (2014). Samples were prepared in dodecyl maltoside micelles at eight different pH values ranging from 4.5 to 8.0 as indicated. (A) Overlay of all eight datasets and the fits obtained from global analysis using model 7 in Table 6. (B) The P(R) obtained for model 7. (C) The OO fraction obtained for model 7 as a function of pH fit to determine the pK value.

