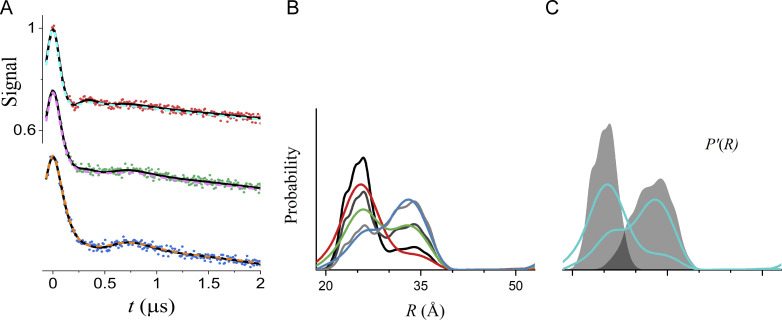
Figure S4.
Global analysis of the same simulated DEER data as in Fig. 4 using Tikhonov regularization. (A) The data are shown as filled circles. The best-fit lines for model 3 (R0 and σR values linked) are shown as solid black lines. The dashed colored lines were obtained using DeerLab version 0.13.2 (Ibáñez et al., 2020) to perform a global analysis using nonparametric distance distributions based on Tikhonov regularization. (B) P(R) from DeerLab for datasets A (red), B (green), and C (blue). The black lines are the true P(R) used for the simulations. (C) The P'(R) of the underlying components of the global analysis obtained from DeerLab are shown in cyan, and the true P'(R) used for the simulations are superimposed as shaded regions. The global Tikhonov fit with unconstrained fractions of the conformations does not recover the proper distributions of the hypothetical pure conformational states if traces representing the pure conformations are not included in the data. The model-based approach (Fig. 4) does recover the pure conformational states because it favors P'(R) with a minimum number of components. If applicable, a chemical equilibrium model and Tikhonov regularization, as is possible with DeerLab, effectively constrains the mole fractions and can recover the true P'(R).

