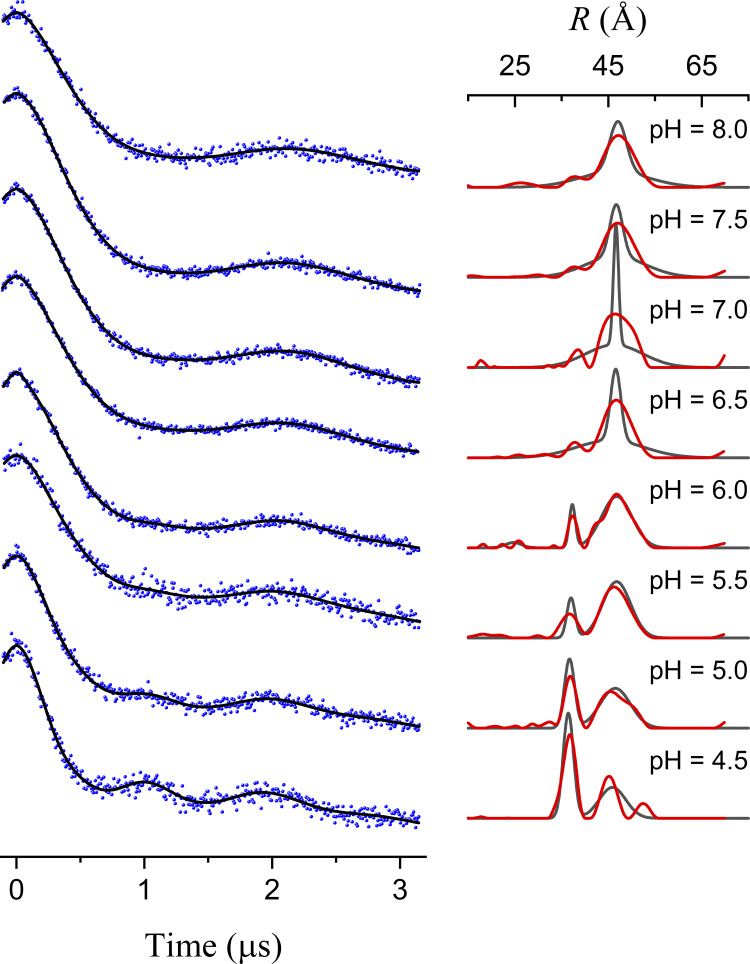
Figure S8.
Results from individual fits for LmrP data in Fig. 8. On the left, the data are shown as black dots with the individual model-based fits as blue lines. The corresponding P(R) are shown (black lines) on the right together with those obtained from Tikhonov regularization using DeerAnalysis 2019 (Jeschke et al., 2006; red lines). The widths of the narrow components at pH 6.5 and 7.0 have large relative uncertainties, and owing to the fact that the modulation is not fully damped over the measured evolution time.

