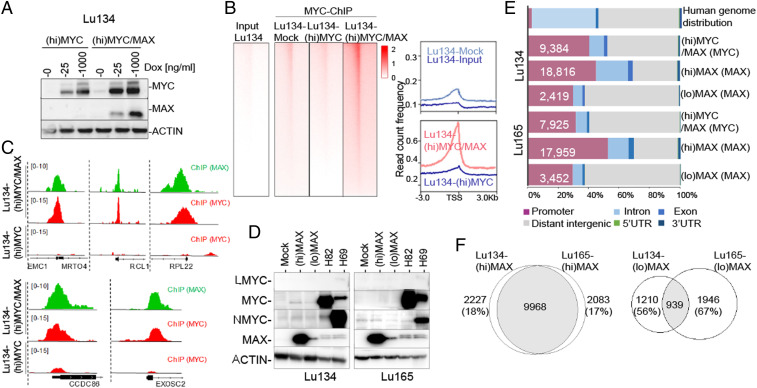
Fig. 2.
ChIP-seq of MYC and MAX in the distinct MAX-deficient cells and genetic backgrounds. (A) Western blot of total lysates to show the levels of MYC and MAX proteins in the indicated cells carrying ectopic overexpression of MYC ((hi)MYC) and of MYC and MAX simultaneously ((hi)MYC/MAX) at different concentrations of doxycycline (Dox). (B, Left) Heatmaps representing the normalized ChIP-seq intensities of ectopic MYC in Lu134-(hi)MYC cells (1,000 ng/mL Dox) and in the (hi)MYC/MAX cells (1,000 ng/mL Dox). (Right) Read count frequency of the heat maps at ±3 Kb regions centered over the TSS of MYC occupancy in the indicated cell models. (C) Representative snapshots from IGV, of ChIP-seq profiles at selected target loci, performed in the indicated cell models. (D) Western blot showing the ectopic expression of MAX ((lo)MAX cells (10 and 5 ng/mL Dox, Lu134 and Lu165, respectively), (hi)MAX cells (1,000 ng/mL Dox), and the levels of the MYC family of proteins in the indicated cells. ACTIN, protein-loading control. The H82 and the H69 cell lines are included as a control of a MYC- and MYCN-overexpressing cells, respectively. (E) Genome-wide functional annotations for peaks generated by the ChIP-seq analyses. Promoters are defined as the regions ±3 Kb around the annotated TSS. (F) Venn diagrams representing the overlap of MAX peaks in the Lu134 and Lu165 cells following expression of high ((hi)MAX) or endogenous-like ((lo)MAX) levels of MAX.

