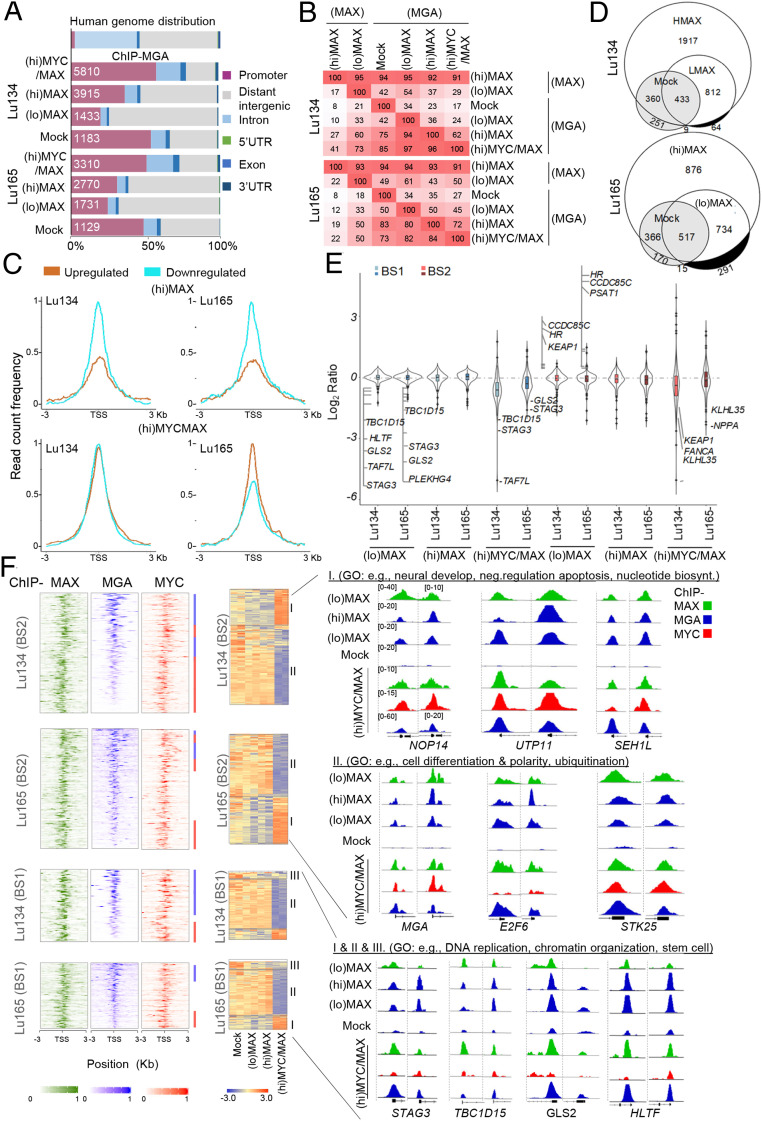
Fig. 5.
MAX restitution enhances the recruitment of MGA to the DNA and represses cell division– and germ cell–related functions. (A) Genome-wide functional annotations for peaks generated from the ChIP-seq analyses. Promoters are defined as the regions ±3 Kb around the annotated TSS. (B) Percentage overlap of peaks at promoter regions of ChIP-seq proteins and cell line models. (C) Read count frequency of the binding of MGA among the genes up-regulated or down-regulated in each condition (from Dataset S1) ±3 Kb regions centered over the TSS, of the MGA occupancy, in each indicated cell model. (D) Venn diagrams representing the overlap of MGA peaks in the Lu134 and Lu165 cells following expression of (hi)MAX or (lo)MAX. The white and gray areas represent the BS2- and BS1-associated promoters, respectively. (E) Violin plots representing the changes in gene expression (transcripts per million) relative to the Mock cells in each cell model and group of MGA-bound promoters (top 10% each of BS1 and BS2). Some of the up-regulated or down-regulated transcripts are indicated. (F, Left) Heat maps representing the normalized ChIP-seq intensities for the MAX, MGA, and MYC proteins in the BS1 and BS2, ranked by the intensity of the MGA binding, centered ±3 Kb around the TSS. (Right) Colored bars indicate the ChIP-seq (MGA, in blue; MYC, in red) with greater intensity of binding in each of the regions. (Middle) Heatmaps of the gene expression from the BS1 and BS2 (10% greater intensity) in the indicated cell lines. Different regions have been labeled (groups I, II, and III) according to their profile of gene expression in (hi)MYC/MAX cells compared with (lo)MAX and (hi)MAX cells. (Right) Representative integrative genomics viewer screenshots for peaks generated by the ChIP-seq analyses in each cell model (screenshots Lu134 and Lu165, Left and Right, respectively). The group and the GO analyses showing selected functions for each group are also indicated.

