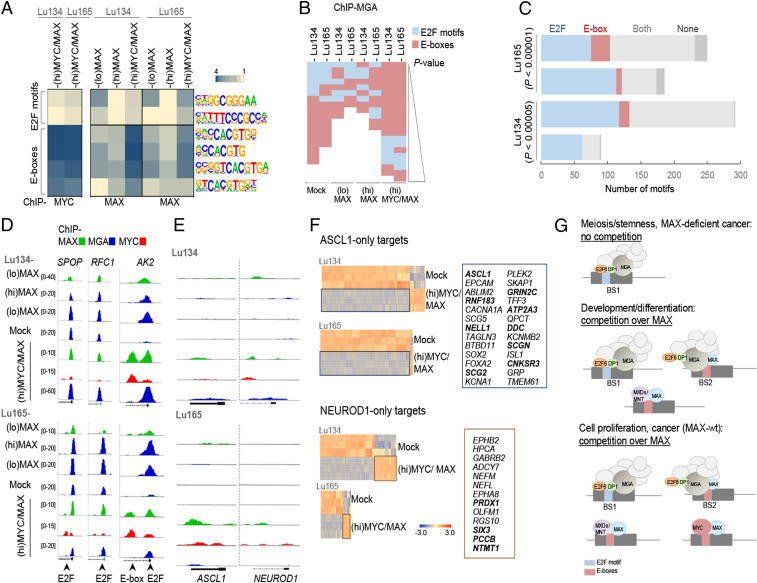
Fig. 7.
MAX restitution shifts MGA DNA-binding profile from E2F sites to E-boxes and MYC-oncogenic activation decreases the levels of ASCL1. (A) Enrichment, given as the abundance relative to background, of the indicated DNA motifs (E2F sites and E-boxes) in the promoters bound by MYC or MAX, of the indicated cells and conditions (Hypergeometric Optimization of Motif EnRichment [HOMER]). (B) Enrichment, ranked by P value (P < 0.01), of E2F motifs and E-boxes found in the promoters bound by MGA, in the indicated cells and conditions (HOMER). (C) Number of E2F motifs and E-boxes in BS1 and BS2 (among the 10% selection) in the indicated cells. P values were determined by Pearson's χ2 test. (D and E) Representative integrative genomics viewer screenshots for peaks generated from the ChIP-seq analyses for each cell type and set of conditions. (F) Heat maps of the gene expression of the ASCL1-only and NEUROD1-only targets selected from ref. 30 (n = 540 for ASCL1 and n = 374 for NEUROD1) among the genes up-regulated or down-regulated in (hi)MYC/MAX cells (from Dataset S1). Selected up-regulated genes from each group are indicated on Right. Those that are common for both cell models are highlighted in bold. (G) Diagram showing scenarios in which the competition for available MAX is important in cell physiological processes and cancer development.

