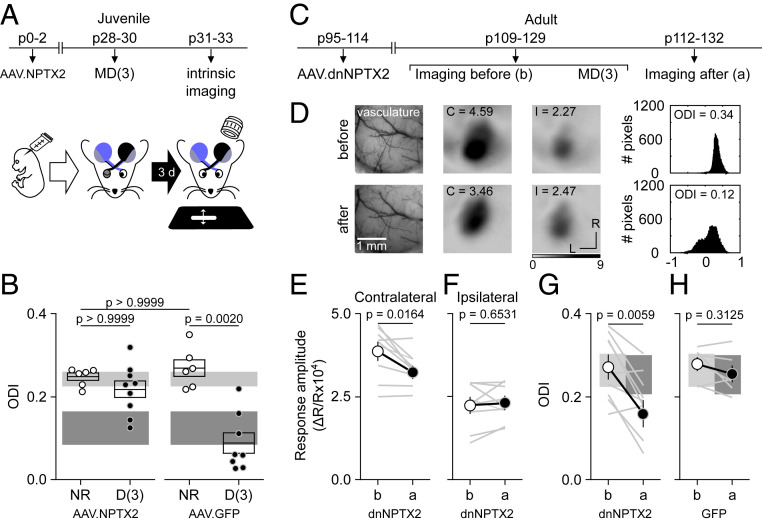
Fig. 4.
Manipulation of NPTX2 can gate ODP. (A and B) Overexpression of NPTX2 prevents ODP in juveniles. (A) Mice were transfected at birth (p0 to p2) with AAV2-CaMKII-NPTX2-SEP or AAV2-GPP. Following 3 d of MD starting at p30 to p31, intrinsic signal responses to stimulation in each eye were recorded in the V1 contralateral to the deprived eye (see Materials and Methods). (B) In NPTX2-transfected mice, the ODI (see Materials and Methods) after MD3 was comparable to ND transfected mice (white circles), and it was reduced in deprived mice transfected with control (AAV2-GFP. Kolmogorov–Smirnov test K = 12.56, P = 0.0013 and Dunns multiple pairs comparison). For comparison, boxes in B depict the 95% CI range of ODI of 44 NR and 8 D nontransfected juvenile mice after MD1 (light gray: NR and dark gray: deprived). (C–G) Expression of dnNPTX2 enables juvenile-like ODP in adults. (C) Adult mice were transfected (p110 to p118) with AAV2-dnNPTX2. The intrinsic signal responses to stimulation in each eye were recorded in the V1 contralateral to the deprived eye before and after 3 d of MD starting at p109 to p129. (D) Example experiment. (Left) Vasculature pattern of the imaged region used for alignment. (Middle) Magnitude map of the visual response from the eye contralateral (C) or ipsilateral (I) to the imaged hemisphere. (Bottom) Gray scale response magnitude as fractional change in reflection ×104. Arrows: L is lateral and R is rostral. (Right) Histogram of ODI is illustrated in the number of pixels (x-axis: ODI and y-axis: number of pixels). (E–H) Summary of changes in the response amplitude of the deprived contralateral eye (E), the ND ipsilateral eye (F), and the change of ODI (G) before (b) and after (a) MD. (H) ODI changes in adult mice infected with control GFP virus. Thin lines in E–H are individual experiments and thick line and symbols are average ± SEM. For comparison, boxes in G and H depict the 95% CI range of ODI of 15 nontransfected adult mice (light gray: NR and dark gray: deprived).

