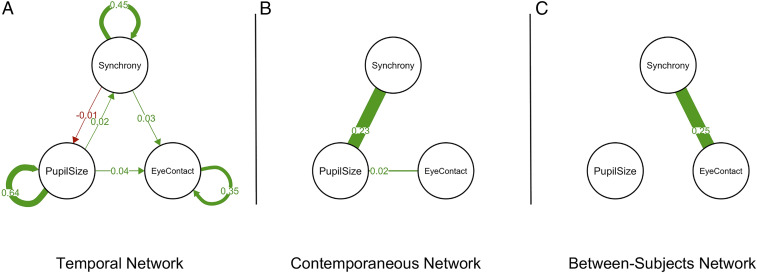
Fig. 2.
Gaussian graphical networks depicting the relationships between pupillary synchrony, pupil size, and eye contact. All edges depict significant relationships at α = 0.05. Edge thickness represents the size of each relationship, and specific edge weights are overlaid on top of each edge. Green edges represent positive relationships, and red edges represent negative relationships. (A) Temporal network illustrating the relationship between pupillary synchrony, pupil size, and eye contact at one lag. Pupillary synchrony and pupil size temporally precede eye contact. (B) Contemporaneous network illustrating the simultaneous relationships between pupillary synchrony, pupil size, and eye contact. Pupil size is positively related to both eye contact and to pupillary synchrony. (C) Between-subjects network illustrating the per subject average relationship between pupillary synchrony, eye contact, and pupil size. Subjects who shared more eye contact during their conversations were more synchronous.

