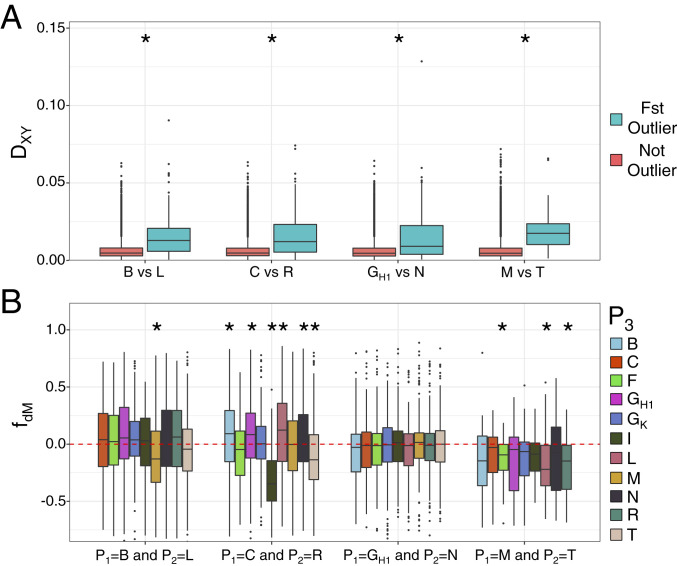
Fig. 4.
Population genetics of the differentiation (FST) outlier regions identified in sister pairs. (A) Sequence divergence (Dxy) statistics calculated in 10-kbp windows. Red boxes are statistics from the genomic background, and green boxes are statistics from the differentiation outlier regions. (B) Localized admixture statistics (fdM) calculated in 10-kbp windows for the differentiation outlier regions identified in sister pairs (A). fdM is a rooted four-population statistic, in which P1 and P2 represent sister taxa and a positive fdM statistic indicates admixture between a third lineage, P3, and P2; while a negative fdM statistic indicates admixture between P3 and P1. For fdM, the genome-wide background is not shown to highlight the differentiation outlier region fdM values. Shown are values for median, first, and third quartiles, with whiskers representing ±1.5* interquartile range. * indicates P < 0.001 after Mann–Whitney U test comparing differentiation outlier region versus the genomic background.

