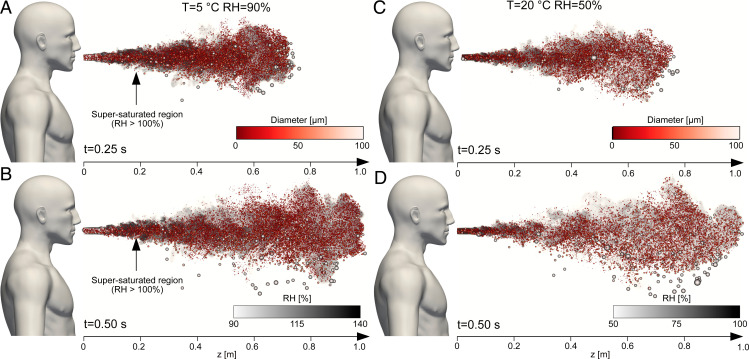
Fig. 2.
Snapshots of the sneezing event at (A and C) and (B and D), where represents the beginning of the respiratory event. A and B refer to and , while C and D refer to and . The background shows the local value of the relative humidity (white, low; black, high). The respiratory droplets are displayed rescaled according to their size (not in real scale) and are also colored according to their size (red, small; white, large). We can appreciate how most droplets move together with the turbulent gas cloud generated by the sneezing jet. This cloud is characterized by a much larger value of RH with respect to the ambient. In addition, for and (A and B), a wide region is characterized by supersaturated conditions ().

