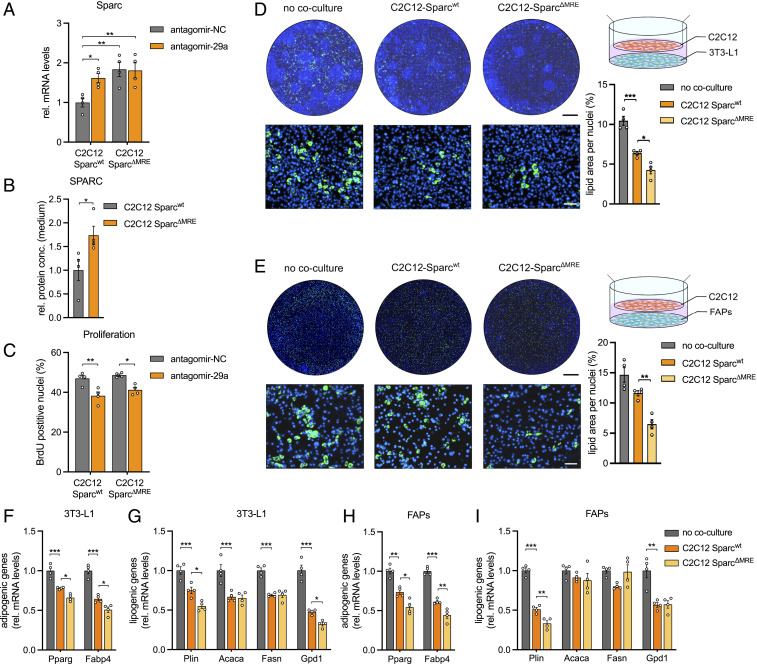
Fig. 2.
miR-29a promotes adipogenesis via down-regulation of SPARC in vitro. (A) Sparc expression in wild-type (wt) or C2C12 myoblasts with deleted miR-29a recognition elements (C2C12 SparcΔMRE) after inhibition of miR-29a (n = 4). qPCR values were normalized to 18S ribosomal RNA (rRNA). (B) Levels of secreted SPARC in conditioned medium from wt or C2C12 myoblasts with deleted miR-29a recognition elements (C2C12 SparcΔMRE) as assessed by enzyme-linked immunosorbent assay (n = 4). (C) Cell proliferation in wt or C2C12 cells with deleted miR-29a recognition elements (C2C12 SparcΔMRE) after inhibition of miR-29a (n = 4). (D and E) Coculture of wt or C2C12 myotubes with deleted miR-29a recognition elements (C2C12 SparcΔMRE) and (D) 3T3-L1 (n = 4) or (E) FAPs (n = 4). No coculture control shows 3T3-L1 cells or FAPs cultured without C2C12 myotubes. Representative images show lipid droplet (Bodipy; green) and nuclei (Hoechst; blue) staining of 3T3-L1 or FAPs on day 8 after induction of adipogenesis. Lipid area was normalized to nuclei. (Scale bar, 5 mm, Top; 100 µm, Bottom.) (F–I) Adipogenic and lipogenic gene expression of (F and G) 3T3-L1 cells or (H and I) FAPs cocultured with C2C12 Sparcwt or C2C12 SparcΔMRE myotubes on day 8 after induction of adipogenesis (n = 4). No coculture control shows 3T3-L1 cells or FAPs cultured without C2C12 myotubes. qPCR values were normalized to 18S rRNA. All data are plotted as mean ± SEM. Significance was evaluated by (A and C–I) one-way ANOVA with Tukey’s multiple comparisons test and (B) two-tailed unpaired Student’s t test. *P ≤ 0.05; **P ≤ 0.01; ***P ≤ 0.001.

