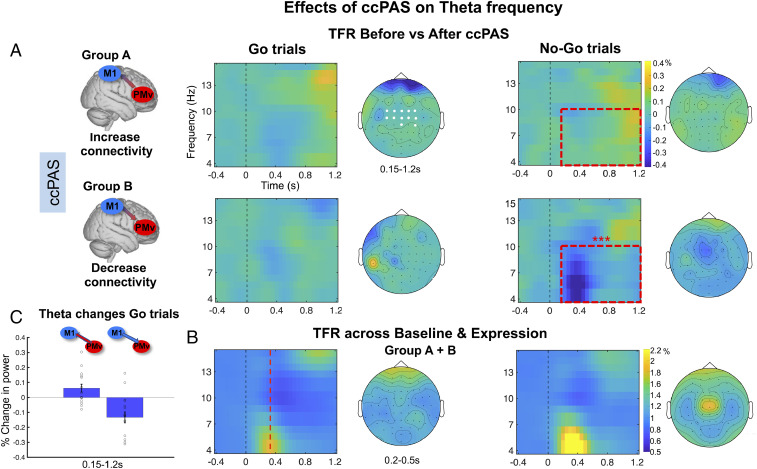
Fig. 3.
EEG time-frequency responses in the theta band in frontocentral sites for Go and No-Go trials (n = 33). (A and B) EEG time-frequency responses in the theta band (4 to 15 Hz) in frontocentral sites (C3, C4, CZ, FC1, FC2, FCZ, C1, C2, FC3, FC4, CP4, and CPZ; electrodes highlighted in white in Top Left topoplot) time locked to the onset of the Go/No-Go stimuli, computed as (A) the difference between Expression and Baseline blocks, (B) the mean of Baseline and Expression blocks collapsing across groups A + B. While B shows the theta effect that was especially prominent in the No-Go trials, A illustrates how this changed as a function of the two types of ccPAS used in groups A and B. The dashed red square in A indicates the time window (0.15 to 1.2 s) in which a significant modulation in theta responses after ccPAS was found. The dashed red line in B indicates the mean RT across Baseline and Expression for Go trials in both participant groups (mean = 352.36 s). (C) Mean theta frequency increase (PMv – M1 ccPAS) and decrease (M1 − PMv ccPAS) computed as the difference between Expression and Baseline in No-Go trials in the 0.15- to 1.2-s time window. Error bars represent SEM, single dots represent individual data points. In A, EEG time-frequency responses represent percentage change in power computed by subtracting the Baseline from the Expression block (0 = no percentage change). In C, EEG time-frequency responses represent relative percentage change in power with respect to the prestimulus interval (1 = no percentage change).

