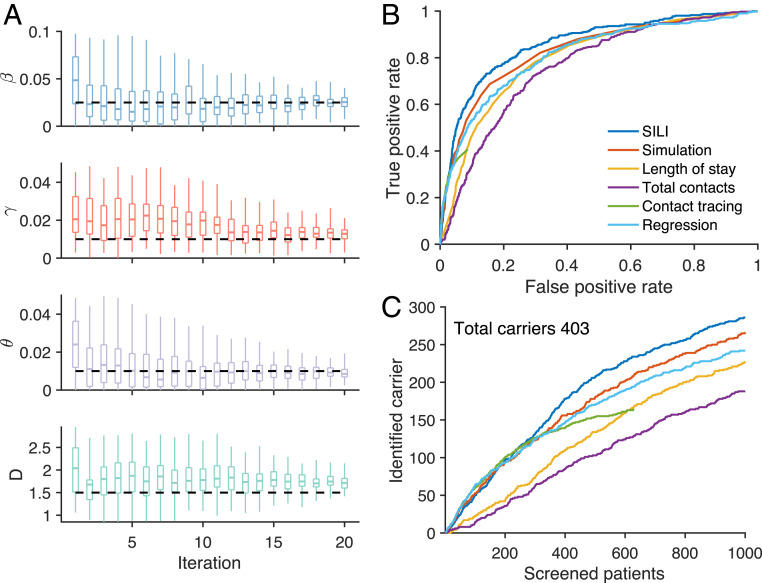
Fig. 2.
Inference of MRSA carriers in a model-simulated outbreak. (A) Inferred distributions of key epidemiological parameters (boxes and whiskers, interquartile, and 95% CI) and the actual values (horizontal dash lines) used in generating the synthetic outbreak. Distributions are presented for 20 iterations of the parameter inference using iterated filtering. The parameters , , , and are the baseline transmission rate, importation rate, baseline environmental contamination coefficient, and the mean environmental decolonization period. (B) The ROC curves for the identification of MRSA carriers using different methods at week 52. The ROC curve for contact tracing is incomplete, as it can only reach a subset of patients who have had contact with observed cases. (C) The number of MRSA carriers identified by screening a given number of patients using different approaches at week 52. The total number of carriers in the hospital is 403. The inference was performed for a simulated outbreak, with the majority of cases colonized within hospital because of person-to-person contacts. Results for a synthetic outbreak with most cases being imported, similar to the situation in real-world Swedish healthcare facilities, are provided in SI Appendix, Fig. S5.

