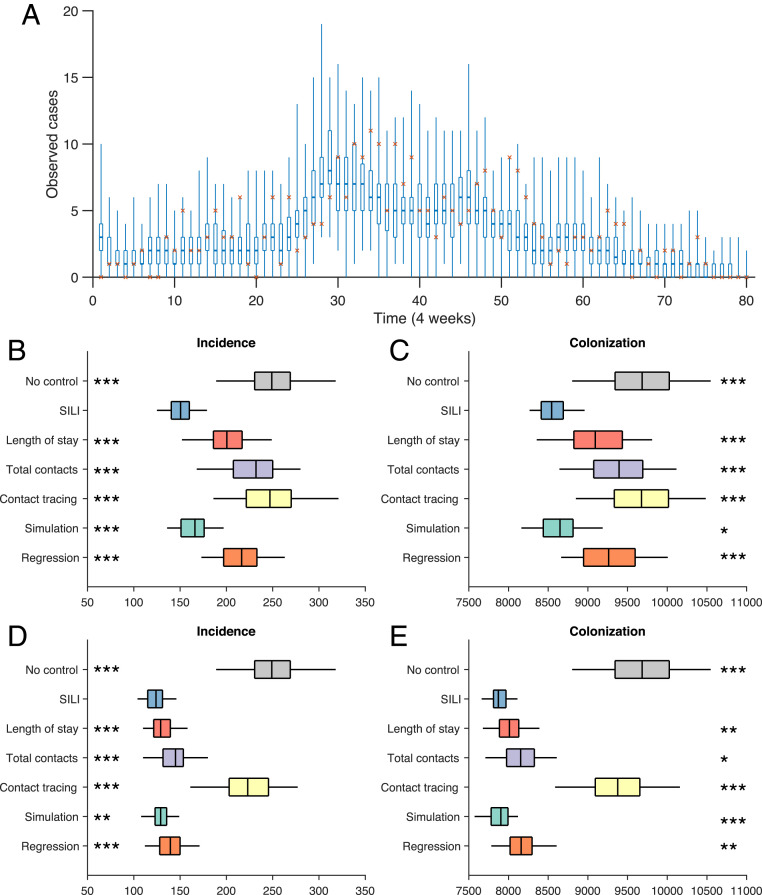
Fig. 4.
Retrospective control experiment in 66 Swedish healthcare facilities. (A) Observed incidence every 4 wk (red crosses) and corresponding distributions generated from simulated outbreaks using the inferred parameters (boxes and whiskers, interquartile, and 95% CI). The calibrated model reproduces the observed incidence in Swedish healthcare facilities during a 6-y period. Results are obtained from 300 simulations. (B and C) Distributions of the observed incidence and total colonization by isolating 1% of patients in the hospital, selected by different methods every 4 wk. Results are obtained from 100 independent control experiments. Asterisks indicate statistical significance that the SILI algorithm outperforms other approaches, obtained from the Mann–Whitney U test (*** , ** , and * ). (D and E) Results for isolating 5% of patients in the hospital, selected by different methods every 4 wk.

