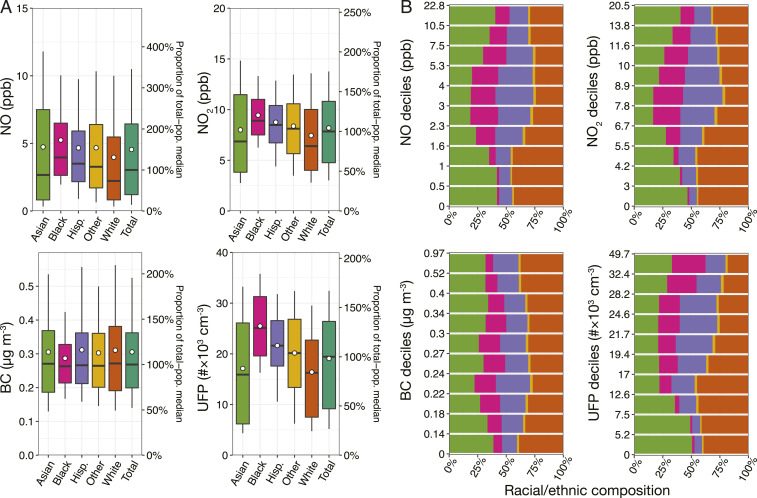
Fig. 4.
Variation in total exposure distributions by race/ethnicity group. The distributions shown in the box-and-whisker plots (A) include the median (central bar), mean (white circle), upper and lower quartiles (box boundaries), and upper and lower 90th and 10th percentiles (whiskers). The division of the total-population exposure distribution into concentration deciles (B) shows the division of the population within the decile by race/ethnicity, with decile boundary concentrations indicated on the y-axis and the racial/ethnic color key provided by the box-and-whisker plots. The White, Asian, Black, and Other race groups only include those identifying as non-Hispanic.

