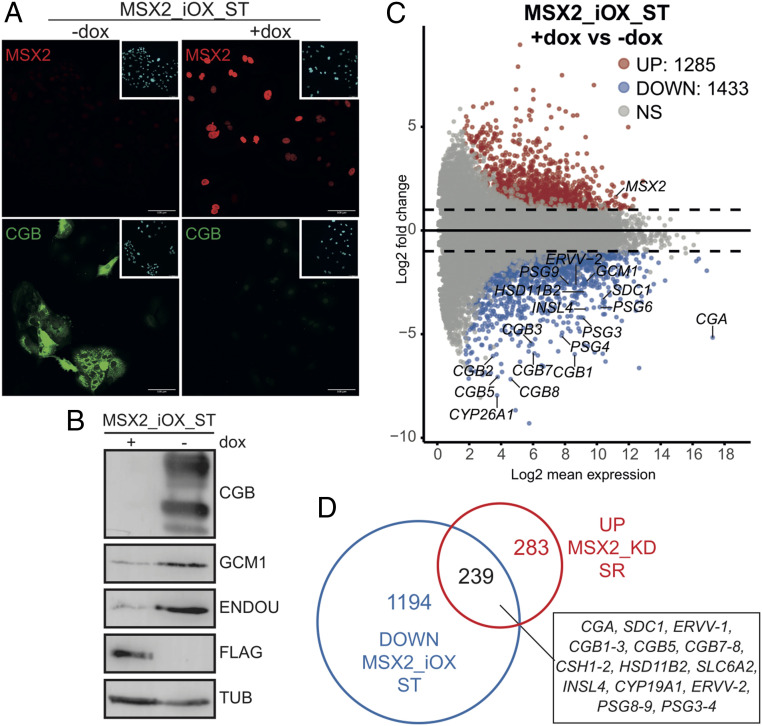
Fig. 2.
Ectopic expression of MSX2 blocks ST cell fate. (A) Immunofluorescence staining for MSX2 and CGB in hTSC line carrying a dox-inducible MSX2 transgene (MSX2_iOX) and differentiated to ST in the presence (+dox) or absence (−dox) of dox. (B) Western blot analysis for ST markers CGB, GCM1, and ENDOU in hTSC line carrying a dox-inducible MSX2 transgene and differentiated to ST in the presence (+dox) or absence (−dox) of dox. The MSX2 transgene carries a 3xFlag-tag; tubulin was used as a loading control. (C) MA plot from differential expressed genes between MSX2_iOX ST +dox (n = 2) and MSX2_iOX ST −dox (n = 3). Analysis (cutoff: |log2FC| > 1, p adj < 0.05) revealed 1,285 up-regulated and 1,433 down-regulated genes in MSX2_iOX ST +dox compared to MSX2_iOX ST−dox. Significantly up- (UP) and down-regulated (DOWN) genes are indicated in red and blue, respectively. Dashed black line highlights log fold changes of −2 and 2. NS: not significant. (D) Venn diagram showing overlap of genes that were up-regulated upon MSX2 depletion (MSX2_KD) in SR conditions (compared to KD control) and genes that were down-regulated (i.e., did not get up-regulated) upon induced expression of MSX2 transgene (MSX2_iOX) during ST differentiation (compared to −dox CTRL). The Venn diagram is based on the RNA-seq analysis detailed in Figs.1F and 2C.

