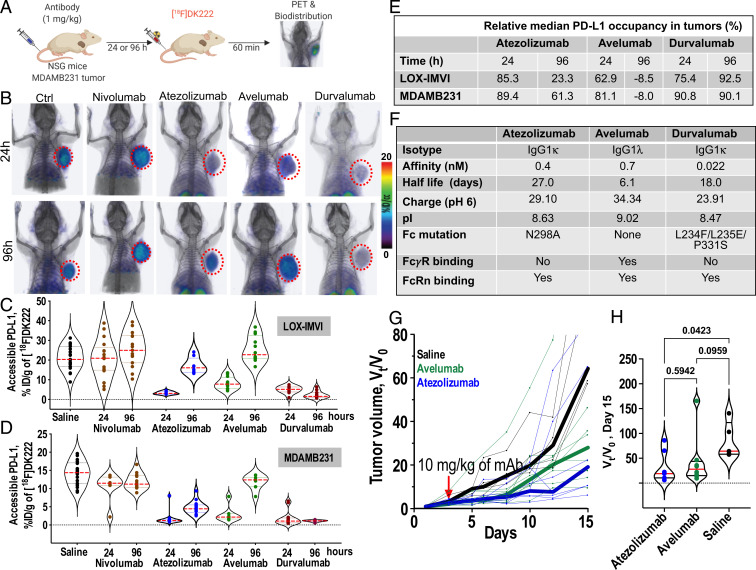
Fig. 7.
Pharmacologic activity of different aPD-L1 therapeutics quantified at the tumor using [18F]DK222 PET. (A) Experimental schematic. NSG mice were treated with atezolizumab, avelumab, or durvalumab (1 mg/kg) for 24 and 96 h prior to [18F]DK222 injection. Nivolumab (1 mg/kg) and saline were used as controls. Imaging and biodistribution studies were carried out at 60 min after [18F]DK222 injection. Data are pooled from two independent experiments. (B) PET-CT images of [18F]DK222 uptake in LOX-IMVI tumors in mice treated with 1 mg/kg of mAbs for 24 and 96 h capturing differing PD-L1 occupancy and PK at the tumor site (n = 3). (C and D) [18F]DK222 uptake in tumors quantified by biodistribution in LOX-IMVI (C; n = 8 to 19) and MDAMB231 (D; n = 7 to 18) tumor-bearing mice. (E) Median PD-L1 occupancy in LOX-IMVI and MDAMB231 tumors treated with aPD-L1 mAbs relative to mice treated with nivolumab for 24 h. (F) Biophysical, molecular, and PK properties of aPD-L1 mAbs. pI and charge values are from ref. 44. (G and H) Tumor growth curves of MC38-hPD-L1 tumors from mice administered a single dose of atezolizumab or avelumab treatment (10 mg/kg, n = 5 to 8) 5 d after tumor inoculation. Tumor volumes are normalized to pretreatment volume (V0) and median growth curves are shown as thick lines. Vt/V0 measurements on day 15 are provided (H). Statistical significance was determined by one-way ANOVA using uncorrected Fisher’s least significant difference test.

