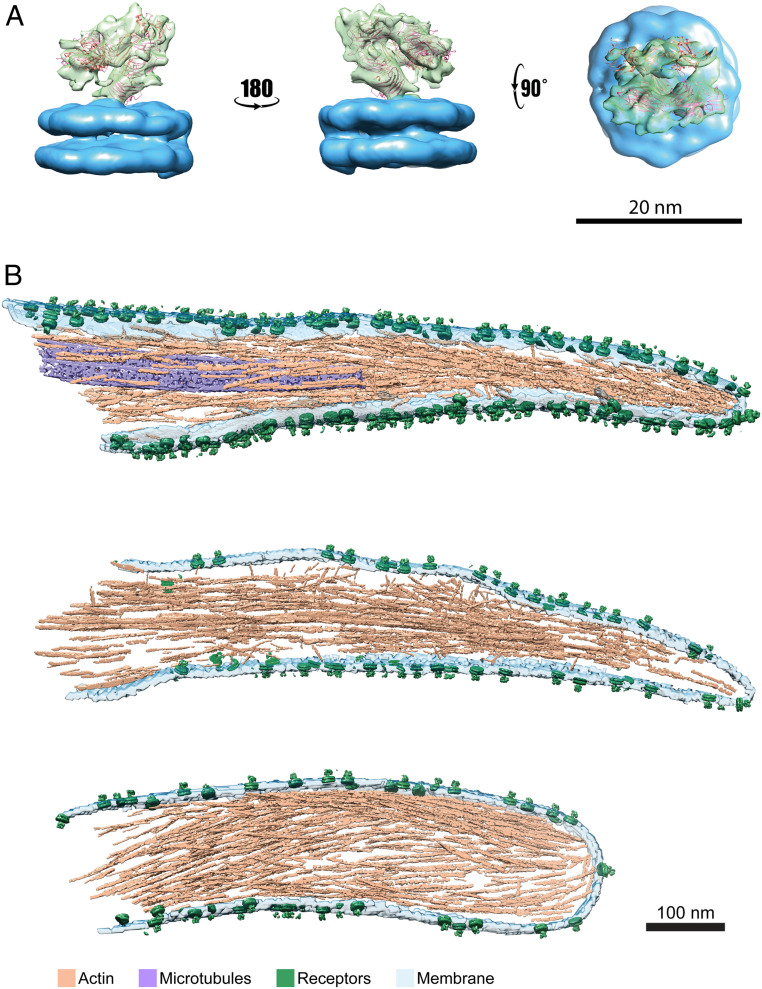
Fig. 4.
Structural analysis of platelets receptors. (A) Subtomogram averaged map of platelet receptors in different orientations, the membrane was colored in blue and the protein receptor in green. The bent integrin structure (PDB ID code 3FCS, in ribbon) was fitted into the density map obtained by in situ structural determination. (B) Surface rendering of three pseudopodia where subtomograms corresponding to the platelet receptor (green) were placed back in the original tomograms using the refined coordinates and orientations. Actin (light brown), microtubules (purple) and membrane (light turquoise). (Scale bar, 100 nm.)

