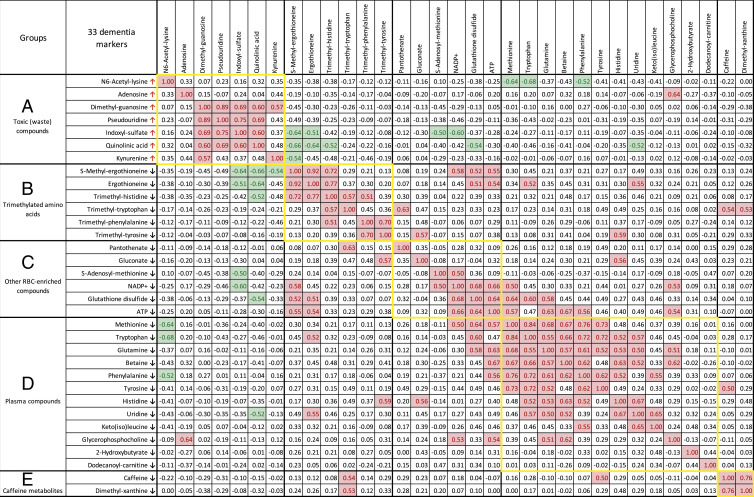
Fig. 3.
Correlation analysis of 33 dementia markers. Correlation values (r) larger than +0.5 are marked with red, whereas values below −0.5 are in green. Compounds that increased or decreased in dementia patients are indicated by arrows. Five subgroups of 33 compounds are shown with frames in yellow.

