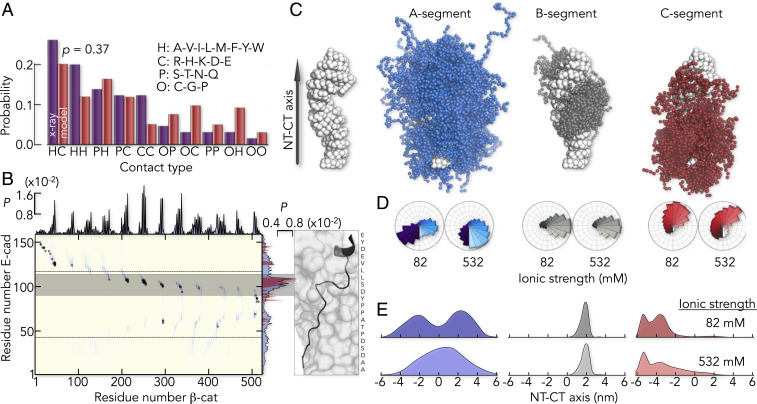
Fig. 5.
The flexible CG model predicts a heterogeneous, structural ensemble of E-cad in complex with β-cat. (A) Distribution of contact types in the complex. The classification of contacts is indicated. A Komolgorov–Smirnov test gives a probability of P = 0.37 that both distributions originate from the same sample. (B) Intermolecular contact probabilities (P) based on the flexible CG model (blue) overlaid with the contact map derived from the X-ray map (gray dots). The highest contact probabilities are found in a 20 amino acid long fragment in the B-segment (gray bar) that is well resolved in both X-ray structures (Right). The projected X-ray contact probabilities of E-cad, averaged over both X-ray structures and all β-cat residues (red area) are shown in comparison to the average contact probabilities of E-cad from the flexible CG model (blue area). (C) Structure of β-cat, indicating the directionality of the axis between (Left) and the ensemble of the center of mass positions (Right) of A- (blue), B- (gray), and C (red) -segment. (D) Center of mass angular distribution along the axis between the NT and CT of β-cat (schematically indicated) at low- (82 mM) and high- (532 mM) ionic strength. Color code is identical to C. (E) Center of mass positional distribution of E-cad projected onto the NT–CT axis of β-cat for the segments A, B, and C at two ionic strengths (indicated). The color code is identical to D and C.

