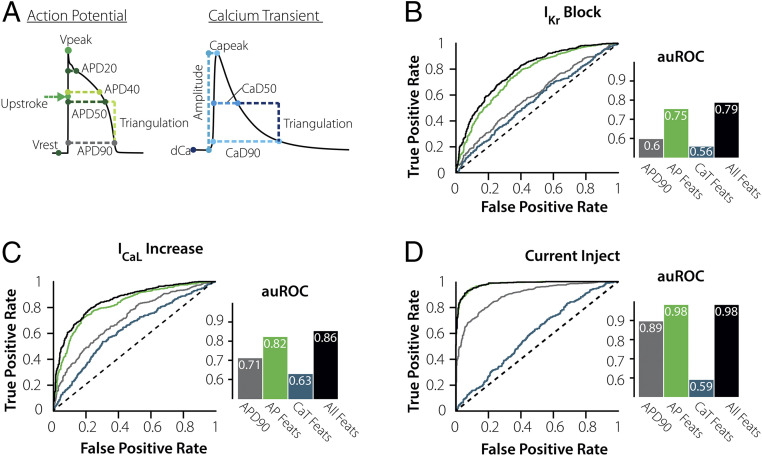
Fig. 3.
Measuring the AP waveform under steady-state conditions greatly improves risk prediction. (A) Additional features describing the AP and CaT waveforms were added to the ML algorithms to test their impact on the predictive performance. (B–D) ROCs and computed auROC plots compare the ML performance for predicting susceptibility using APD90 (gray), eight AP Waveform features (green), six CaT Waveform features (blue), and 14 combined AP + CaT Waveform features (black). Predicting risk with just the AP Features improves the overall results for ICaL Increase and IKr Block and is superior for Current Injection. However, adding the CaT waveform features has no significant impact for any trigger.

